Rising Sea Levels: A Watery
Fate for Airports
December 2021


Sea levels are rising because of global warming. The global mean sea level (GMSL) during the 20th Century rose by an estimated 1.4mm a year. In the decade up to 2015 its rate of increase had increased to 3.6mm a year and since then accelerated to 4.6mm a year. It doesn’t sound much: but as the chart shows this works out at a metre since 1993.
The Arctic sea ice extent, according to NSDC and NASA, has fallen significantly in all months since satellite measurements started in 1979, and the current level of decline is running at 13% a decade (relative to the 1981-2010 average). The Antarctic ice sheet is losing 152 gigatonnes of mass each year, while the Greenland ice sheet is declining at an annual rate of 267Gt. Since 2002 between them the ice sheets have lost a total of 7,700Gt of mass. That’s a lot of water.
The melting of the sea ice (as opposed to glaciers and ice on land) shouldn’t matter, as Archimedes might have pointed out. But it does: the less ice, the less the heat reflection and greater heat absorption, accelerating a warming of the pole. And while global mean sea levels may not be affected, the water released is redistributed (among other things by changes in ocean currents and gravitational field, the earth’s rotation, and the earth’s own viscoelasticity) and in some areas could have a distinct impact on local average sea levels.
Disturbingly it is likely that the GMSL will continue to rise even if humanity achieves net-zero greenhouse gas emissions by 2050. The IPCC in its central case, assuming that global warming is limited to 1.5°C rise above preindustrial levels, suggests that mean sea levels could rise by a further metre by the end of the century. If emissions continue to grow, that increase could be 2m, but if the polar ice sheets melt more rapidly, some researchers suggest that we could be looking at a rise of more than 3m.
Published last February in Elsevier’s Climate Risk Management is an excellent scholarly article — Global analysis of sea level rise risk to airports (Yesudian and Dawson). Corporate climate risk assessments from such as Heathrow, Sydney and Massport, have concentrated on individual airport vulnerability. This study, the authors claim, is the first to look at the relative importance, capacity and connectivity of the world’s airports subject to potential disruption from sea level rises.
As the authors point out, many cities in the world are close to the sea, and 10% of the world’s population live in an area near the sea coast that is less then 10m above sea level — known as the Low Elevation Coastal Zone (LECZ). Airports are often built in low lying areas for practical reasons: proximity to the cities and population they serve; large areas of flat land; and take-off and landing trajectories that minimise the risks of collision. Coastal wetlands, marshlands, floodplains and reclaimed land, can provide this. With sea levels rising along the majority of the world’s shorelines, the risks to low-lying airports will inevitably increase.
Some are already below sea level. Masada’s Ben Yehuda is the lowest-lying airport in the world at 380m below mean sea level, but is neither globally important nor within a LECZ. But Amsterdam and Rotterdam are (respectively at 3.4m and 4.5m below sea level). The Netherlands is used to the dangers of flooding: the country’s national sea defences are continuously being strengthened to meet the norm of a flood chance of once every 10,000 years.
The norms are changing. In 2021, the Royal Dutch Meteorological Institute updated central forecasts to suggest sea level rises of 2m by the end of the century (its 2014 assumptions had been for a 1m increase).
But there are also many other major airports in the low elevation coastal zone that like Amsterdam are essential to current connectivity. And recent weather events show how severely connectivity can be disrupted:
The storm surge from typhoon Jebi in 2018 exceeded 3m and created the highest recorded water level in Osaka Bay. At its peak, waves 5m high washed over the sea walls inundating Kansai Airport. The airport was closed for three days, and only fully reopened three weeks later.
In 2012 Hurricane Sandy hit New York. All three airports were affected by a 4m storm surge: JFK was flooded from Jamaica Bay, and Newark was hit by the storm surge that coursed through New York Harbour and into Newark Bay, flooding the eastern sections of the busy international gateway.
LaGuardia took the brunt of the damage as the waters of Flushing Bay poured over the edges of the airport, flooding parts of its 2,000m long east-west runway, and damaging lighting and navigation systems. Had the storm struck at high tide it was estimated that the terminals would also have been flooded causing even more disruption. As it is the storm caused 10,000 flight cancellations into and out of the New York area, and had knock-on disruptive effects round the world. LaGuardia was only able to open, partially, three days later.
Methodology
The report’s risk analysis combines information about the location of airports, their exposure to storm surges for current and future sea levels, their (pre-Covid) connectivity and aircraft traffic, and their current standard of flood protection.
From a full dataset of over 14,000 airports and helipads, the authors identified 1,238 airports in the LECZ and combined aircraft schedules to identify routes at risk. The US had the largest number of airports (199) and routes (3,436) in the zone while China had the second largest number of routes at risk (2,333) from 30 airports. However, Australia (72), Indonesia (43), French Polynesia (39), Bahamas (34) and other countries have more airports at risk than China although they operate fewer flights.
Some of the airports are of strategic importance. The top 20 largest airports in the LECZ (see table) handled 1bn passengers and 26.6m tonnes of cargo in 2018, respectively 23% and 30% of the global totals.
The authors applied a range of scenarios for the rise in sea levels to calculate a ranking of airports with according to the number of routes liable to disruption under each scenario. The order of airports in the rankings change depending on the scenario chosen. Beyond a number of airports at risk in Europe, North America and Oceania, the airports in East and Southeast Asia and the Pacific dominate the top 20 for present day and lower sea level rise scenarios. Bangkok has the highest risk except for the most pessimistic scenario where Shanghai Pudong has the highest risk. In all but the most pessimistic scenario, China has the largest number of airports ranking in the top 20.
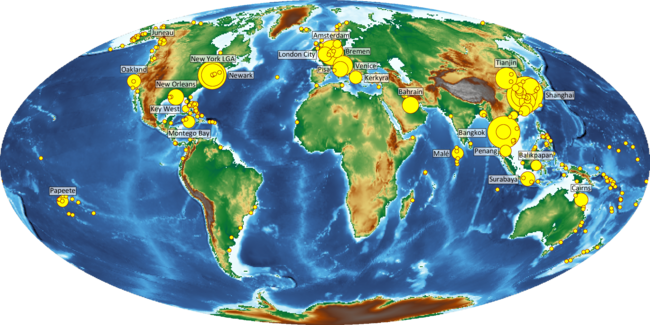
In the map we show those airports most at risk from the pessimistic option. This suggests that the one in 10,000 year event will hit the Netherlands before the country celebrates its 500th birthday.
Major airports are already at risk of coastal flooding. Sea level rise associated with a global mean temperature rise of 2°C would place 100 airports below mean sea level, whilst 1,238 airports are in the Low Elevation Coastal Zone. A global analysis has assessed the risk to airports in terms of expected annual disruption to routes. The method integrates globally available data of airport location, flight routes, extreme water levels, standards of flood protection and scenarios of sea level rise. Globally, the risk of disruption could increase by a factor of 17-69 by 2100, depending on the rate of sea level rise. A large number of airports are at risk in Europe, Northern American and Oceania, but risks are highest in Southeast and East Asia. These coastal airports are disproportionately important to the global airline network, by 2100 between 10 and 20% of all routes are at risk of disruption. Sea level rise therefore poses a systemic risk to global passenger and freight movements. Airports already benefit from substantial flood protection that reduces present risk by a factor of 23. To maintain risk in 2100 at current levels could cost up to $57bn. Although the cost of protecting larger airports is higher, busier airports are typically well protected and more likely to have better access to adaptation finance. However, 995 coastal airports operate 5 commercial routes or fewer. More detailed consideration of these airports shows that regions, especially low lying islands, will experience disproportionate impacts because airports can provide important economic, social, and medical lifelines. Route disruption was used as the risk metric due to its global coverage and relationship with direct economic impacts. Further work should collate a wider range of impact metrics that reflect the criticality of an airport in terms of the isolation and socio-economic context of the location it serves.
| Airport | Elevation | Routes | Terminal Pax | Freight |
|---|---|---|---|---|
| (m) | (m) | (‘000 tonnes) | ||
| Amsterdam | -3.35 | 268 | 71.1 | 1,717 |
| Bangkok Suvarnabhumi | 1.52 | 161 | 63.4 | 1,495 |
| Miami | 2.44 | 170 | 45.0 | 2,300 |
| Bangkok Don Mueang | 2.74 | 95 | 40.8 | 55 |
| Fort Lauderdale | 2.74 | 140 | 36.0 | 84 |
| Shanghai Hongqiao | 3.05 | 77 | 44.6 | 407 |
| Barcelona | 3.66 | 226 | 50.2 | 173 |
| Shanghai Pudong | 3.96 | 216 | 74.0 | 3,769 |
| New York JFK | 3.96 | 194 | 61.9 | 1,431 |
| San Francisco Intl | 3.96 | 135 | 57.8 | 590 |
| Shenzhen | 3.96 | 145 | 49.3 | 1,219 |
| Doha | 3.96 | 157 | 34.5 | 2,164 |
| Rome Fiumicino | 4.57 | 204 | 43.0 | 206 |
| Copenhagen | 5.18 | 209 | 30.3 | 365 |
| Newark | 5.30 | 189 | 46.1 | 45 |
| Boston Logan | 5.82 | 130 | 40.9 | 290 |
| Sydney | 6.40 | 104 | 44.4 | 527 |
| Singapore | 6.70 | 153 | 68.3 | 2,010 |
| Seoul Incheon | 7.01 | 164 | 68.3 | 2,952 |
| Hong Kong | 8.53 | 163 | 71.5 | 4,800 |