LATAM Airlines: Rewriting Alliance
Strategies
December 2019

“It was an offer we couldn’t refuse.” So said LATAM’s outgoing CEO Enrique Cueto when remarking on the approach by Delta to take a 20% stake, remove some embarassingly unwanted A350s and persuade South America’s largest airline to switch alliance from oneworld to SkyTeam.
The previous strategy had been stymied by the courts in Chile: LATAM had passed all the other hurdles to enable it to set up an immunised JV operation with American Airlines to the US and with Iberia and British Airways on the South Atlantic. But the Chilean Supreme Court, on appeals from Chilean tourism groups and consumer associations against regulatory approval from the competition authority, was not convinced by the arguments of double marginalisation which underpin the US DoT approval of joint ventures. It stated that the proposed joint ventures would result in the airlines acquiring a market position that would be “difficult to challenge” in an industry that already has high barriers to entry. This led to a major rethink of strategy.
LATAM Airlines is the largest airline group in South America. It was formed from the merger between LAN Chile and its Brazilian rival TAM Airlines in 2012, and operates to 143 destinations in 26 countries with a fleet of 330 aircraft, carrying around 70m passengers a year.
It has a third of the market among airlines of the South American continent in terms of seats (and a quarter in terms of the number of flights). It it twice the size of its nearest competitors, GOL Linhas Aéreas Inteligentes, Avianca, Azul and Aerolíneas Argentinas.
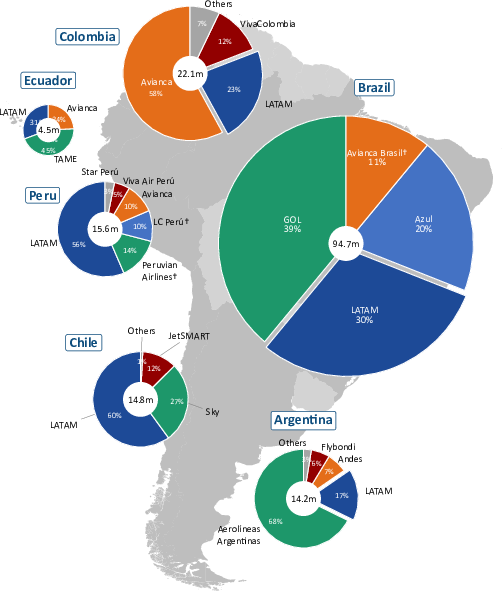
Three quarters of its traffic is carried on domestic routes (see chart), a little over half of which is accounted for by Brazil — the largest market in the region — in which it is the second largest player with a 30% market share in 2018 (before the failure of Avianca Brasil in June 2019). The other principal domestic markets — which the group combines in its reports as the domestic markets of Spanish Speaking Countries (SSC) — include Chile and Peru (where it is the dominant player with 60% and 56% of the market respectively), Colombia, Argentina and Ecuador.
About 24% of its traffic is carried on international routes (two thirds of which we estimate to be within South America, where it has nearly half the market) from the main capital cities of Santiago, São Paulo, Buenos Aires, Lima and Bogotà.
Following the merger, the erstwhile economic buoyancy in the region evaporated. Brazil fell into a deep recession in 2015 and 2016 with real GDP declines of 3.5% in each year (see table), while from 2017 the region was badly impacted by the rise of US protectionism, the US dollar and decline in local currencies. The Brazilian economy has been recovering, but growth rates are well below levels in the 2000s. Argentina has also slipped into a severe recession with hyperinflation producing a significant devaluation of the Argentinian peso. And then towards the end of 2019, civil unrest in Chile, originating from an increase in public transport fares, has undermined confidence in the Chilean peso and provoked fears for the direction of that country’s economy.
Despite this background LATAM has done well. It went through a severe cost cutting and rationalisation programme after the merger. It cut domestic operations in Brazil by a quarter (in ASK terms) between 2012 and 2017, but saw load factors rise by nine percentage points to 82.7%. In the SSC domestic markets over the same period it increased capacity by an average annual 5% with demand climbing by 6% and load factors improving by 3.4 percentage points to 82%. International operations grew at a slower rate of 3% a year, but here too load factors grew by two percentage points to 84.3%. Group revenues have fallen by 20% from the peak $13.3bn in 2011.
While this restructuring led to some deep losses at the net level — the Group lost a total of $1.1bn between 2012 and 2015 — LATAM in the last four years has been generating modestly good operating margins of between 5% and 7% and gradually improving net profits: for the rolling twelve months to end September 2019 it reported an operating margin of 7.1% and a net income of $356m (a margin of 3.4%) — the best performance since the merger.
One of the reasons behind this is that the structural reforms it put in place to generate synergies from the merger seem to be working. In 2018 it finalised a massive IT undertaking to coordinate all the reservation and ticketing systems across the group. All operating subsidiaries now work under the LATAM Airlines brand and under the “LA” IATA code (except for LATAM Brasil which still for the moment uses TAM’s “JJ” code for flights to the USA). It has successfully introduced a simple four category pricing structure with various levels of unbundling (to allow passengers to pay for what they want) to enable it to compete more effectively with the incursion of ULCCs into the market.
One of the other reasons for recent good performance is consolidation in the region — through airline failures. Avianca Brasil (which had 11% of the Brazilian domestic market) fell into cash flow difficulties and finally expired in June 2019: in the six months to end September LATAM saw unit revenues in Brazil jump by 20% year on year. In Peru two carriers with 24% of the domestic market between them went out of business — LC Perú in December 2018 and Peruvian Airlines in October 2019.
Delta to the rescue
At the time of the merger between LAN and TAM the former had been in the oneworld alliance, the latter in SkyTeam. The new group decided to align with oneworld as a natural fit: cultural links with Iberia and Spain for the SSC in LATAM’s portfolio (and weakness for Iberia into Brazil); good fit with American, the largest player in South America among the US carriers, with excellent links through its major hub in Miami.
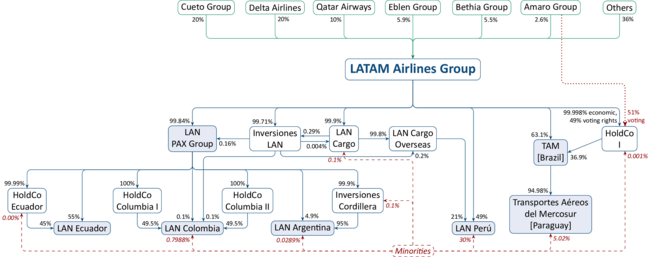
When the Chilean Supreme Court denied the approval of a joint business agreement (particularly with American) the Group may have considered going ahead with the JV but excluding the LAN Chile passenger operation, as every other country concerned had approved the JV, but this would have led to a significant level of complexity. Not that LATAM is unused to the idea of complexity (see chart).
Strategically for Delta it is an excellent move. They offered a full joint business deal between South America on routes into the USA, $350m assistance in the cost of moving from the oneworld alliance, to acquire four A350s from LATAM and assume LATAM’s commitment to acquire 10 additional aircraft that LATAM has on order for delivery from 2020; and to cement the deal a promise to acquire 20% of the LATAM equity (for c$1.9bn) through a public tender on the open market. For this they get route access into the one remaining continent where its presence was weak.
The public tender offer closed on 26th December 2019 — successfully. Delta now controls 20% of the share capital of the LATAM Airlines Group, while the Ceuta Group (the former controlling shareholders of LAN) have sold down some of their stake to an equal 20%.
It will be interesting to see if the new ownership causes a problem for Qatar Airways who bought in a 10% stake in LATAM as part of its strategy of investing in oneworld airlines — probably not.
The Amaro Group (former controlling shareholders of TAM Airlines) have gradually sold down their interest, and it looks as if the Brazilian family now only own 2.6% of the shares. Their presence in the ownership structure had been essential. At the time of the original merger, Brazil had a policy that a Brazilian airline could have no more than 20% foreign ownership, and the deal was structured so that they had 80% of the voting rights in the LATAM subsidiary (HoldCo I) that assumed the ownership of TAM Airlines. Brazil subsequently revised its laws to allow up to 49% foreign ownership and then in the last year both removed foreign ownership restrictions entirely (in the hope of keeping Avianca Brasil alive), ratified an open-skies agreement with the USA, and initiated full open-skies agreements with other members of the Mercosur trading bloc.
However, this does mean a complete shift in alliances in the region. Delta will be selling its stake in GOL and will probably tell Air France-KLM to sever its links with GOL (including its shareholding and abandoning an idea of a join AFKL-GOL hub in Recife). This may leave GOL, the second largest player on the continent open to a link with either IAG/American (oneworld) or United/Lufthansa (Star Alliance) — except that United has recently taken effective control of Avianca. But then IAG recently announced an agreed takeover of Air Europa, while Azul’s stake in TAP Air Portugal is rumoured to be in doubt.
The LATAM development may have a couple of more general implications. First, Global Branded Alliances (GBAs), offering mainly marketing and some operational cooperation, are vulnerable to defections by important regional powers, if another major carrier can offer the huge benefit of an antitrust immunised agreement. Second, no alliance, even if bonded with equity, is immutable in the long term.
| At year-end: | 2015 | 2016 | 2017 | 2018 | 2019E | 2020E | 2021E | 2022E | |
|---|---|---|---|---|---|---|---|---|---|
| Passenger aircraft | |||||||||
| narrowbody | A319-100 | 50 | 48 | 46 | 46 | 46 | 41 | 41 | 41 |
| A320-200 | 154 | 146 | 126 | 126 | 136 | 138 | 134 | 138 | |
| A320neo | 2 | 4 | 4 | 13 | 18 | 24 | 29 | ||
| A321-200 | 36 | 47 | 47 | 49 | 49 | 49 | 49 | 49 | |
| A321neo | 4 | 9 | 13 | ||||||
| Total narrowbody | 240 | 243 | 223 | 225 | 244 | 250 | 257 | 270 | |
| widebody | A330-200 | 10 | |||||||
| 767-300 | 38 | 37 | 36 | 35 | 31 | 29 | 28 | 28 | |
| A350-900 | 1 | 7 | 5 | 7 | 8 | 10 | 9 | 9 | |
| 777-300ER | 10 | 10 | 10 | 10 | 10 | 10 | 10 | 10 | |
| 787-8 | 10 | 10 | 10 | 10 | 10 | 10 | 10 | 10 | |
| 787-9 | 7 | 12 | 14 | 14 | 16 | 18 | 20 | 20 | |
| Total widebody | 76 | 76 | 75 | 76 | 75 | 77 | 77 | 77 | |
| Cargo aircraft | |||||||||
| 777-200F | 3 | 2 | 2 | ||||||
| 767-300F | 8 | 8 | 8 | 9 | 11 | 11 | 11 | 11 | |
| Total cargo | 11 | 10 | 10 | 9 | 11 | 11 | 11 | 11 | |
| OPERATING FLEET | 327 | 329 | 308 | 310 | 330 | 338 | 345 | 358 | |
| Aircraft leased out | |||||||||
| A320-200 | 5 | 5 | 5 | 5 | 5 | 5 | |||
| A350-900 | 2 | 2 | 3 | 1 | |||||
| 777-200F | 1 | ||||||||
| 767-300F | 3 | 3 | 1 | 1 | 1 | 1 | 1 | 1 | |
| Total subleases | 4 | 3 | 8 | 8 | 9 | 7 | 6 | 6 | |
| TOTAL FLEET | 331 | 332 | 316 | 318 | 339 | 345 | 351 | 364 | |
Fleet plan excludes the Airbus A350 aircraft to be assigned to Delta
| 2018 | Real GDP Growth (%ch) | |||||||||||
|---|---|---|---|---|---|---|---|---|---|---|---|---|
| GDP ($bn) | Population (m) | GDP per capita (PPP) | Trips per capita | 2015 | 2016 | 2017 | 2018 | 2019e | 2020e | 2021e | 2022e | |
| Argentina | 519 | 44.6 | 20,551 | 0.7 | 2.7 | -2.1 | 2.7 | -2.5 | -3.1 | -1.3 | 1.4 | 2.3 |
| Brazil | 1,868 | 208.5 | 16,146 | 0.6 | -3.6 | -3.3 | 1.1 | 1.1 | 0.9 | 2.0 | 2.4 | 2.4 |
| Chile | 298 | 18.8 | 25,700 | 1.3 | 2.3 | 1.7 | 1.3 | 4.0 | 2.5 | 3.0 | 3.2 | 3.3 |
| Colombia | 331 | 49.8 | 14,936 | 0.8 | 3.0 | 2.1 | 1.4 | 2.6 | 3.4 | 3.6 | 3.7 | 3.8 |
| Ecuador | 108 | 17.0 | 11,760 | 0.5 | 0.1 | -1.2 | 2.4 | 1.4 | -0.5 | 0.5 | 1.6 | 2.7 |
| Peru | 225 | 32.2 | 14,242 | 0.8 | 3.3 | 4.0 | 2.5 | 4.0 | 2.6 | 3.6 | 4.0 | 4.0 |
Note: † trailing twelve months to September 2019. IFRS16 implemented Jan 2019.
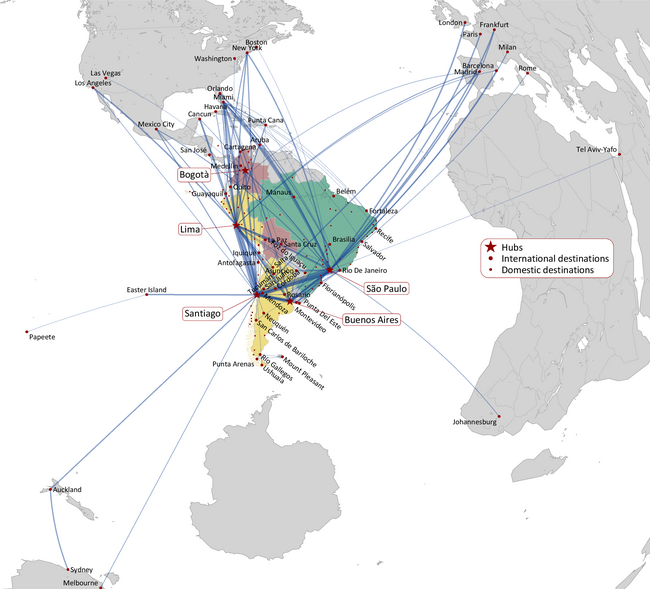
Notes: equidistant map projection based on Santiago (great circle routes appear as straight lines); thickness of lines proportional to number of seats.