The evolution
of easyJet
December 2019

EasyJet and Ryanair were both children of wrath. Or at least September 11 2001 transformed the prospects of the two barely-established new entrants. As traffic collapsed, orders were cancelled and traditional carriers teetered, the two manufacturers turned their attention to the new LCCs, suddenly desperate to strike deals.
Both easyJet and Ryanair negotiated and placed mega-orders at hugely discounted unit prices, locking in a long-term critical cost advantage as the purchase contracts included price guarantees that were carried through to future orders. Ryanair choose the maximum seat capacity available — the 189-seat 737-800 — while easyJet eventually opted for the 156-seat A319 rather than the 737-700. The Airbus/Boeing decision was extremely close, and no single factor was decisive, but easyJet went for Airbus, switching from its previous 737-300 fleet policy, bringing an unforeseeable advantage 17 years later. EasyJet management at the time had no precise idea of where the 240 new A319s would operate but there was belief in the operating model, which has generally been justified.
Ryanair has never deviated from its original concept (except maybe with its recent multi-branding experiment — see Aviation Strategy, August 2019), and has always been led by Michael O’Leary, sometimes brilliant, usually irascible, sometime amusing, sometimes obnoxious, religiously following his version of the ultra low cost model. EasyJet, on the other hand has tried to move away from the pure LCC model, positioning itself somewhere between the ULCCs and the Legacies, whose short-haul product has become over the years more like easyJet’s.
Continuity of top management has been a feature of the Ryanair approach while easyJet has gone through several management regimes — first, under Ray Webster, the architect of easyJet’s successful expansion, then under Andrew Harrison when the carrier seemed to lose its way, followed by Carolyn McCall who came from an unlikely media background, and since December 2017 under Johan Lundgren, a Swedish national who was previous Deputy CEO of TUI.
The founder Stelios Haji-Ioannou soon tired of jokey pictures of himself with specs drawn on, and retreated to Monaco from where he berated the underperformance of the airline, which is still 35% owned by himself and close relatives, under Andrew Harrisons’s management. He was soothed by the escalation in share price under Carolyn McCall, and has remained (ominously?) quiet about Johan Lundgren’s regime.
EasyJet has been polishing its ESG (Environmental and Social Governance) credentials. It measures customer satisfaction (not too good, rated 74% in 2019 against 80% in 2015), on time performance (again down to 75% in 2019 from 80% in 2015), is open about the detailed criteria used to establish directors’ remuneration, and is very keen on environmental issues.
In fact easyJet has announced that from December 2019 it will be a zero carbon emissions airline. It has achieved this by by buying carbon offsets from two companies that invest in carbon neutralisation, planting trees among other projects. This will cost easyJet just £25m or 25p per passenger, though this is in addition to the estimated £100m-plus easyJet has to spend on buying carbon credits under the European Emissions Trading Scheme (ETS). Still for a small outlay, easyJet has undoubtedly enhanced its brand.
Branding mysteries
Branding is a curious process, but one that easyJet (and the other easyGroup companies) has always taken very seriously; we turn to some quotations from Lis Blair, Chief Marketing Officer at easyJet, in a recent interview with Campaign, the publication for media and advertising types, which summarises easyJet’s current positioning — how a LCC markets itself without mentioning price.
“A brand surviving on rational proof-points alone (and predominantly price) in a highly competitive market would surely find itself in a race to the bottom. We needed to elevate the brand from price alone — to create an emotional connection with our customers. To come of age…
“So we set out to appeal on a more emotional level to increase affinity and drive brand consideration — aiming to reawaken a love for travel by taking customers on a flight of imagination.
“To drive this change, we needed to make some subtle but fundamental changes to our advertising, starting with our pan-European brand campaign.
“It was a thing of beauty…. A sense of calm, taking the listener into a dream-like state, instantly evoking that flight of imagination.
‘Imagine where we can take you. EasyJet. Europe from £29.99.’
“But I had a hunch. A hypothesis that the price message was superfluous, telling people what they already knew, maybe even holding us back.
“And guess what? It turns out with the price message there, that’s all people recall from the ad. When you remove it, other messages are appreciated and remembered. Including value — so we still convey value without talking about price. Low-cost travel is so strongly associated with easyJet that people still take it out as a key message without us even needing to mention it.”
The financials
Back from marketing exuberance to some uncreative financials.
In FY2019 (to September 30) easyJet grew capacity by 10.3% to 105.0m seats while passengers booked increased by 8.6% to 96.1m, causing a slight decline in load factor to 91.5%. With unit revenue dipping by 1.8% to £60.8/seat, total revenue rose by 8.3% to £6.4bn.
Unit costs rose by 1.6% to £56.7/seat, but would have declined if has not been for an escalation in fuel prices. Total operating costs rose by 11.7% to £5.9bn. To contain costs and reduce the operational problems that afflicted the airline in recent years easyJet has invested in data-based tools to predict and remedy operational problems, crewing issues and ATC delays. These seem to be working as the number of “disruption events” was down by 30% in FY2019 compared to 2018.
Operating profit fell to £466m from £595m in the previous year while net profit after tax was down to £349m from £466m.
The balance sheet remains solid with £8.2bn of assets, including £1.3bn of cash, against total liabilities of £5.2bn, giving shareholders’ equity of just under £3bn. Its credit rating is high for an airline, BBB+.
The financial outlook for easyJet is positive in the short/medium term. For FY2020 the Bloomberg consensus is an improvement in operating profit to £494m, up 6%, which may be too cautious if easyJet can seize the opportunity offered by its rivals' MAX problems.
Because of that marginal fleet selection decision made back in 2003 easyJet does not have the 737 MAX headache today. Both Ryanair’s and TUI’s growth plans are dependent on MAX deliveries resuming in the second quarter of next year, which is looking increasingly uncertain, and they in the meantime have unproductive capital tied up at Boeing and management attention diverted to negotiating compensation payments. Easyjet has its own problems with Airbus and delays to A321 deliveries, but on nothing like the same scale.
EasyJet’s flexible fleet strategy is shown in the chart. Its base plan is to increase the fleet by only 30 units between 2019 and 2023 (though the mix will change with more neos in the fleet). In dire circumstances It could reduce its 2023 fleet by 48 units from the planned 2020 level by retiring aircraft at 16 years, or it could add 31 units by extending leases if the market is better than expected.
Given easyJet’s commitment to low capacity growth — 3% planned for FY 2020 — it seems unlikely that it will take advantage to an extension of the MAX crisis by boosting capacity. Its aim is to push unit revenues up, which is the story that it is presenting to investors, but is a strategy that has hardly ever worked for LCCs (see Ryanair comparison below).
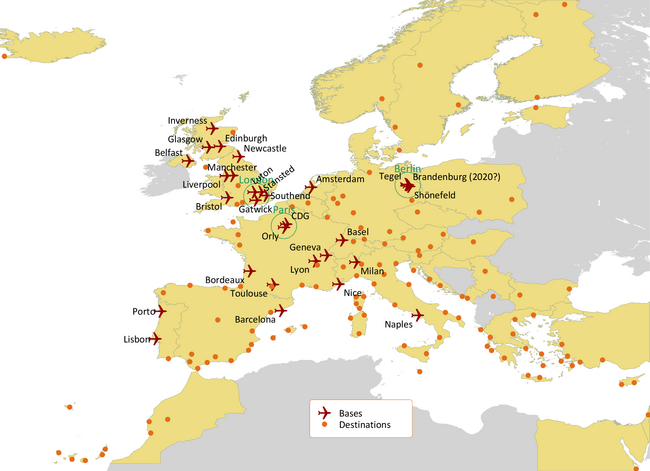
EasyJet’s network strategy has in recent years concentrated on building capacity at its main bases, including buying slots out of airline bankruptcies (notably, Thomas Cook slots at Gatwick and Bristol for £36m and investing €40m in taking over the leases of 25 A320s and Berlin Tegel slots from Air Berlin). It is aiming to gain increased pricing power from maximising market shares at its bases and boosting frequencies between its bases in preference to adding new points.
The airline is the largest carrier at each of its five most important bases — Gatwick, Tegel, Geneva, Luton and Milan Malpensa — and it is also number one at the next three airports of Nice, Bristol and Basel while achieving second position at Paris CDG and Amsterdam, the global hubs for Air France/KLM. The graph of easyJet’s top 20 routes shows the strong preponderance of connections between its main bases. It also indicates the increasingly business-orientated nature of the network, for which frequency is usually a major demand factor. Only Gatwick-Barcelona and Luton-Nice are predominantly leisure routes, and these are not traditional mass market holiday destinations. VFR still plays an important role in routes like Belfast-Gatwick.
EasyJet has always been strong in yield management, using dynamic pricing techniques in advance of its LCC and Legacy rivals. In the 2019 results presentation management emphasised how the airline is “innovating with data”, with a “shift in algorithms towards predictive demand management”. What this means is that it has succeeded in pushing up the yield curve for close-to-flight bookings; In the German market, for example, yields in the final week before departure in August 2019 were 37% higher than those in the same month in 2018.
easyJet vs Ryanair
However, there is little evidence as yet that the data innovations have translated into improving yields on a systemwide basis. In FY2019 easyJet’s total revenue per passenger at £66.50 was marginally down on 2018; excluding ancillaries, the average fare was down 1.6% to £52.10. Chart 1, the first in a series of six comparing easyJet with Ryanair over FY2014-19, shows easyJet’s unit revenue declining by an average of 1.0% pa over this period, though the gap with Ryanair has broadened as its unit revenues have fallen by 2.6% pa. In 2019 easyJet unit revenues were 45% above those of Ryanair.
Unit costs tell a very different story. Although there was a slight convergence on 2019, easyJet’s operating costs, excluding fuel, were 74% higher than Ryanair’s. This presumably was a factor behind the decision to recruit Peter Bellew, Ryanair’s COO. Bellew’s appointment was highlighted in the results presentation in October but he has been trapped in a law suit alleging breach of contract, with Ryanair attempting to block his move to a rival airline. Just before Christmas an Irish court found that the non-compete clauses of Bellow’s employment contract were invalid, as the terms were too broad, but this is not the end of this painful tale as Ryanair has launched an appeal.
In terms of fleet operational efficiencies easyJet can claim to be ahead of Ryanair, as illustrated by the simple measure of passengers per aircraft: easyJet now carries 7% more than Ryanair. Load factors for both carriers are extremely high — 92% for easyJet and 95% for Ryanair — but easyJet achieves a much higher utilisation — 10.9 block hours/day compared to Ryanair’s 9.0 hours. EasyJet’s focus on building frequencies between its bases has brought scheduling benefits which are reflected in the higher aircraft utilisation, counterbalancing the effect of longer turn times at congested airports. Also, easyJet has been increasing its average seat capacity — as it has shifted from A319s to A320/21 neos. It now averages 175 seats per aircraft and the addition of more neos will push the average close to Ryanair’s 189 by 2023.
Interestingly, in the course of the court case, Bellow made the point that many of Ryanair’s cost strategies could not be transferred to easyJet or other carriers as they were unique to Ryanair. Graphs 4 and 5 illustrate cost/efficiency elements that are fixed in the two carriers’ models. EasyJet evidently needs more employees to deliver its service than Ryanair — in 2019 about 50 employees per aircraft against Ryanair’s 36. The focus on primary airports and the fact that easyJet does not have the opportunity to negotiate volume-based discounts at its airports (Gatwick vs Stansted) results in a major difference — 150% higher for easyJet — in average airport/handling charges per turn.
Finally a reminder that, in terms of the bottom line, Ryanair is more profitable than easyJet — by 26% on a pre-tax profit per passenger basis in 2019 — though the gap between the two carriers has narrowed as both carriers’ profitability has declined in recent years.
The competition
Comparison with brutally efficient Ryanair is a check on how the two original European LCCs have diverged specifically in cost terms. But easyJet, as emphasised above has moved away from pure price competition. The pie chart encapsulates easyJet’s direct competition — seat capacity by airline type on easyJet’s network (admittedly a narrow definition as it only covers airport to airport markets as opposed to city to city).
Nevertheless, the analysis is illuminating. In its own network market easyJet provides just under half of seat capacity and all other LCCs another 20%, but ULCCs, ie Ryanair and to a lesser extent Wizzair, only account for 6%, the rest being the likes of Eurowings, Transavia, Norwegian, Vueling and Jet2.
Network or Legacy carriers represent by some margin the biggest competitor group — 25 % of seat capacity on easyJet routes. This breaks down into: Air France/KLM, 10%, reflecting easyJet’s number two position at CDG, Orly and Schiphol; Lufthansa Group, 6%; IAG, 4%, which understates the competition between Heathrow and Gatwick services; and other smaller flag-carriers, 5%.
The direct competition from charter/AIT airlines was limited to about 4% of easyJet’s network in 2018 when Thomas Cook/Condor and TUI each accounted for roughly half of this share.
Re-inventing AIT
Following the demise of Thomas Cook easyJet has decided to make a major expansion into Air Inclusive Tours (AITs). Why does it think that it can succeed in this sector where so many others have failed, and which has been written off by its LCC competitors?
The company appears to be adapting the IT model to the 21st century. Firstly, it is offering maximum flexibility, giving vacationers the opportunity to construct their own trips and hotel stays around their own timeframes. It can do this simply because of the frequency and breadth of its schedule. To illustrate: the graph shows the London to Mediterranean country destinations in 2018 when Thomas Cook was still in business. The volume of easyJet flights dwarf those of the charter/AIT companies — it can offer 3-4 flight per day in summer whereas the charter carriers might only have only 3-4 a week. EasyJet also has the edge on Ryanair which has retreated from the Ryanair Holidays product it introduced three years ago and is much larger, in this market, than the package holiday specialist Jet2.
Second, the scale of its operation will, easyJet claims, enable it to negotiate attractive hotel room prices and short cancellation conditions. It will minimise on-site administration costs by using only hotels that are 4 or 5 star rated by TripAdvisor (though seasoned travellers are justifiably sceptical about some of these ratings).
Third, the technology used will be “best in class”. Certainly, the website (www.easyjet.com/holidays) does appear to be very clear, flexible and user-friendly.
One problem easyJet may have is moving the model into the German market. Unlike the UK and Scandinavia where internet holiday booking has become the norm, Germany is highly traditional, still using high street travel agencies and printed brochures (only 13% of TUI’s German bookings are made online). A large part of the reason is German retail law which is designed to protect local shops — holidays have to offered at the same price online as on the high street.
In total easyJet estimates its market opportunity to be the 20m passengers who fly easyJet for a holiday and book accommodation elsewhere. This is essentially ancillary revenue for easyJet — it will be attaching hotel rooms to existing flight schedules not changing schedules to accommodate hotel demand — and the impact on operating profit may be relatively modest. Analysts at Bernstein estimate a £30m accretive potential, which compares to 2019 EBIT of £466m. Johan Lundgren has promised transparency for this new enterprise which will have it own specialised management and P&L.
Longer term speculation
The obvious path for easyJet to follow is the one that it is currently on — refining its position between the ULCCs and the Legacies, growing capacity conservatively and producing reasonable but not industry-leading profit margins. The persistent problem for easyJet it that it has tended to underperform both Ryanair and IAG in terms of the stockmarket — see chart.
There might be a radical opportunity — take advantage of a possible collapse of Norwegian by taking over selected long-haul routes at Gatwick, using A321LRs. It has already experimented with short/long haul connection through its Worldwide by easyJet product offering assisted self-connections at its major bases, although Worldwide did not get a mention in the FY 2019 presentation. But in an environmentally-conscious era, easyJet might have a unique proposition — 80% of aviation carbon emissions come from just 20% of the global fleet, mostly long-haul aircraft; easyJet could not only market its zero emission credentials but also promote the fact that its high-density long-haul would drastically cut emissions per passenger.
FY end September
AVERAGE RETURN FLIGHTS PER DAY
Note: Flights from all London airports; based on 2018 schedules