Alaska Air: Harvesting the benefits of the Virgin America merger
December 2018

Alaska Air Group has seen its profits dip sharply in the two years since the closing of its $4bn acquisition of Virgin America in December 2016. But with 90% of the integration completed, the Seattle-based carrier is now ready to start harvesting the benefits. At its November 27 investor day, the management outlined plans to return to 13-15% pretax margins in the next couple of years. Is such a goal achievable?
Before the merger Alaska was one of the most financially successful airlines in the US. It was an industry leader on many fronts, be it cost reduction, profit margins, debt reduction, managing to ROIC or returning capital to shareholders.
Impressive cost reduction and deleveraging programmes, launched in the late 2000s, had given Alaska LCC-level unit costs and early investment grade credit ratings. It earned spectacular 24% pretax margins in both 2015 and 2016.
Alaska had a great brand, outstanding customer service and a strong culture. It was also a technological innovator; among other things, it was the first airline to sell tickets online and the first to have airport kiosks.
So why do a merger and screw that up? The main reason, according to the management, was that Alaska needed a bigger platform to remain competitive and to keep growing.
A series of mergers had given the four largest US carriers much more market power; by 2016 they accounted for 84% of domestic revenues. Although Alaska still had growth opportunities in its Pacific Northwest franchise, the management “could see our runway shortening” after years of rapid growth.
After two decades of ASM growth averaging 7.7% annually, and 10.6% growth in both 2015 and 2016, Alaska had gained very high 65% “customer relevance” in the Pacific Northwest (a measure of nonstop service). But it had only 19% relevance in California — a state that has more than three times the population of Alaska, Washington and Oregon combined. It was tough to grow organically in California because of airport infrastructure constraints.
The Virgin America acquisition represented an opportunity to get a solid foothold in California and to grow on the West Coast as well as nationally (because the deal also brought more access to slot-constrained airports on the East Coast).
Alaska paid a big premium for what it considered “scarce real estate”, so it was in a hurry to take advantage of the combined network. It launched as many as 44 new markets in 2017, which was in addition to the 38 acquired with Virgin America.
One particularly interesting development has been the increase in cooperation with international airlines and what Alaska executives describe as a “real mind shift” in the way they view global partners (see below).
The addition of Virgin America boosted Alaska’s ASM growth to 40.6% in 2017; on a combined basis, ASMs were up by 7.1%. This year has seen 5.3% capacity growth.
Merger integration has gone flawlessly and at record pace — not really surprising given the management’s track record and the ability to benefit from the experience of past mergers. The messiest parts of integration are now behind the airline.
Alaska has done a decent job in blending the two very different brands and products. As evidence, it has continued to win “best US airline” type awards. One such award in Q3 from Conde Nast Traveller was especially meaningful because Virgin America had won it 10 years in a row; now Alaska has extended it to 11 years.
Despite there being very little left of Virgin America (which was all about the in-flight product, while Alaska is all about service and FFP), there has been no mass defection from Virgin America loyalists.
One likely reason is Alaska’s loyalty programme, which is claimed to be the most generous in the industry. Since the merger Alaska’s Mileage Plan revenues have grown by 38%, from $720m to $1bn annually.
But Alaska’s profits have taken a hit in the past two years. Its adjusted pretax profit fell from the 24%-level in 2015-2016 to 16.6% in 2017 and to around 8.5-9% in 2018.
The current consensus estimates see Alaska earning a 6.4% adjusted net margin this year and 8.6% in 2019, down from the 15%-level 2-3 years ago.
The management blames the margin deterioration on higher fuel prices, new labour agreements, increased competitive capacity growth, and Alaska’s own post-merger growth spurt.
In the past two years Alaska has signed market-rate JCBAs with 93% of its unionised workforce. Much of the labour cost hike was attributed to being behind the curve, but bringing Virgin’s workers to Alaska’s higher pay rates must have also been a factor.
In the past three years the US West Coast has become a hotbed of competition. Many airlines focused their growth there because the economy was stronger, and then the Alaska-Virgin America merger triggered competitive responses. Alaska’s RASM has declined every year since 2014.
In the past two years Alaska has had as much as 10% of its total capacity “under development”, which tends to have a negative impact on profitability.
At the investor day, the key message was that the focus would now shift from integration to improving financial performance. CEO Brad Tilden stated: “We believe we passed through an inflection point in the last few months and we’re now moving to harvest time and realising the benefits of the merger”.
Tilden also announced a goal of returning to 13-15% pretax margins in the medium term. It was not presented as a formal target but, rather, a “mind set” — a level of pretax profit the management believes Alaska is capable of, and should be, earning.
Some analysts are sceptical that Alaska can return to industry-leading margins anytime soon, given the competitive scene on the West Coast (which could intensify further if fuel prices remain at the current lower levels).
But most analysts have responded positively because Alaska’s management is very highly regarded, because near-term RASM trends are positive, and because a credible “road map” for margin improvement was presented at the investor day.
Alaska projects significant multi-year “margin drivers” in four categories (see table): remaining merger synergies ($235m), new revenue initiatives ($240m-plus), operational efficiencies ($75m-plus) and support-function efficiencies ($85m-plus).
As much as $130m of the additional merger synergies and $200m of the extra revenues from new initiatives are expected to be realised in 2019, so higher profitability next year seems virtually guaranteed.
Alaska is also benefiting from an improved industry revenue environment, as domestic fares have continued to inch up even as fuel prices have declined. Alaska’s RASM growth has turned positive in the current quarter and analysts tentatively project a 4%-plus increase in 2019.
The RASM outlook is benefiting from Alaska’s decision (earlier this year) to slow ASM growth to only 2% in 2019, followed by 4% growth in 2020. But the slower growth will put pressure on unit costs. Once the profit margins have recovered, Alaska plans to return to 4-6% annual capacity growth.
Merger integration progress
2018 has seen much progress with the merger integration: systems operation control (SOC) in January, single passenger control services (PSS) in April, joint collective bargaining agreements or transition deals with the last three unions (flight attendants, dispatchers and maintenance workers) in April-November and an integrated seniority list for the pilots in August.
The single PSS was a critical milestone in that it allowed Alaska to start unlocking many of the revenue synergies. It meant the retirement of the Virgin America brand (April 25).
It was a feat to secure all of the labour deals and integrated seniority lists (ISL) in less than two years. In other US airline mergers achieving ISLs took 3-6 years.
Alaska has begun mixing and matching aircraft and expects to fully deploy cross-fleeting by March. Cabin attendants, who have undergone cross-training to work on two aircraft types, are due to begin working as one team in February.
The process of converting Virgin America’s Airbus fleet to the Alaska configuration is expected to be completed by the end of 2019. It entails adding more premium seats, eliminating some economy seats and reducing the premium seat pitch; the net effect is to increase the total number of seats. The move will facilitate Alaska’s generous complimentary upgrades policy for elite FFP members, increase revenues and lower unit costs. Alaska estimates the revenue benefits at $40m.
The Alaska-Virgin America combination is expected to generate $300m in annual net synergies when fully integrated — $240m revenue benefits and $60m cost synergies. Only $65m of the $300m total synergies have been realised so far.
Much of the future effort will focus on culture, which is critical for an airline that emphasises engagement and attributes much of its success to a “small company feel”. There are no real issues, but the management feels that the integration has put a “tremendous amount of strain” on the culture.
Among other measures, Alaska is spending $15m to put all of its 23,000 employees through interactive one-day workshops with the leadership over the winter. Called Flight Path, the events take place in a huge rented warehouse. The workers attend in mixed groups of 600 to discuss topics such as shared values, working together as a team, history, plans, vision, etc. They can ask questions and air their concerns, and there is a “great social afterwards”.
Alaska is tackling culture so aggressively that it is hard to imagine there not being a successful outcome. Importantly, Alaska also pays well and is recognised as a good employer (as Virgin America was).
New revenue and cost initiatives
Alaska was behind its peers in product segmentation and ancillary fees, so it was easy to find revenue initiatives.
First, Alaska has just launched its version of basic economy, Saver Fare. The move is projected to generate $100m in additional annual revenue.
Second, Alaska has increased its previously relatively low bag fees to bring them in line with those in the marketplace — a $50m revenue opportunity.
Third, new ancillary revenue initiatives (dynamic pricing, upgraded food and beverage menus, exit row sales, etc) represent another $50m revenue opportunity.
Fourth, Alaska targets a further $40m in revenues from corporate contracts or deals with travel management companies.
Those four items add up to a significant $240m in revenues from new initiatives, most of which is expected to be realised in 2019.
On the cost side, Alaska has identified $160m of multi-year savings from higher productivity, schedule optimisation, self-service technology, reduced overheads, improved purchasing power, and selling and distribution. Most of those are either merger synergies or represent a reversal of temporary inefficiencies created by the merger.
However, most of the cost savings will only be realised from 2020 onwards. 2019 will see a continued “training bubble”, most of the Airbus retrofits, unusually high growth on the regional side (which has double the mainline costs) and $25m investments in the product and culture. Regional capacity will surge in 2019 because of the peaking of E175 deliveries to Horizon.
Nevertheless, Alaska expects to limit the increase in non-fuel CASM to only 2-2.5% in 2019, which would be impressive in light of the mere 2% capacity growth.
Low costs are critical to Alaska’s business model. Alaska believes that it has a roughly 20% cost advantage over the legacy carriers on a stage length-adjusted basis (largely unchanged in the past two years) and that it has narrowed its gap to Southwest to mere 0.67 cents (see chart).
Network and alliance moves
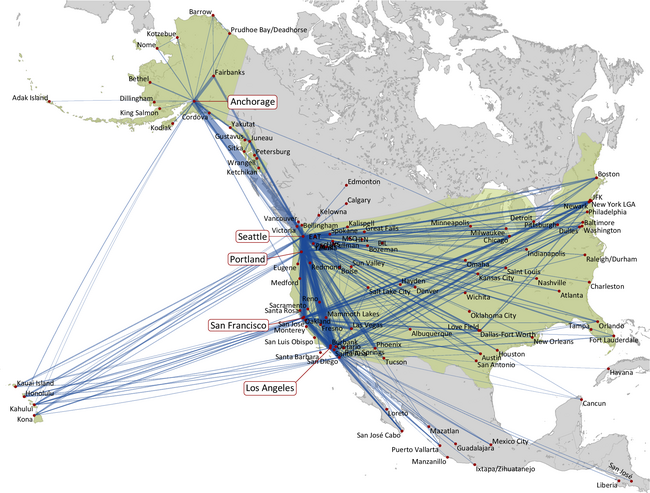
After two years of growth to “connect the dots” and some restructuring of the network inherited from Virgin America (notably, VA’s Dallas Love Field-East Coast and Mexico services have gone), Alaska feels that it now has the right network in place.
Alaska claims that the West Coast network is now the industry’s strongest. In the past two years, its West Coast-originating nonstop markets have increased from 233 to 283, daily flights from 756 to 931, seat share from 20% to 24% and customer relevance from 33% to 48% (the runner-up Southwest has 41% relevance).
In California, Alaska has considerably strengthened its position: its daily departures have increased by 71% (to 330-plus) and its customer relevance has more than doubled to 40%. But the 12% seat share reflects the fact that California is an important market for everybody.
California presents a sizeable opportunity for Alaska to grow its loyalty and credit card programmes, because only 6.5% of its customers there currently have its credit card, compared to 44% in the Pacific Northwest.
The combination has a decent New York franchise, with 30 daily departures split equally between New York JFK and Newark. Earlier this year Alaska leased its LaGuardia and Washington Reagan slots to another airline until 2028, as it cannot currently use them for transcon service because of perimeter rules (generally limiting flights to less than 1,500 and 1,250 miles respectively).
Alaska is fortunate to have a very strong position in the West Coast-Hawaii market, with mostly nonstop operations from eight West Coast gateways to four islands. That and a differentiated product will help it weather the competitive effects of Southwest’s entry next year.
Alaska has maintained its 55% seat share in Seattle, its primary hub, despite an influx of competitor service. Seattle is now very congested, but there are solutions in sight. First, Horizon is able to launch E175 service in Q1 2019 from nearby Paine Field, which is getting a $40m passenger terminal. Second, expansion projects at Seattle, including a new 20-gate terminal, are due to be completed in 2021-2022.
Lack of infrastructure is a serious problem at all of the key West Coast airports, but Alaska executives said that, with some $48bn of expansion projects under way or planned, they felt reasonably good about the longer-term prospects.
However, there will be fierce competition for any new facilities that open up at the key California hubs. United recently announced its largest ever international network expansion from San Francisco. Southwest, among others, is keen to grow from Los Angeles.
The investor day message was that there would be no major changes to the Alaska network in 2019 or 2020; rather, the focus would be on optimising the schedule and getting the right aircraft in the right markets.
The best example of the latter is allocating the larger 737-900ERs to the highest-density transcon markets to replace the smaller A320s, which are better deployed in north-south flying. There will also be much aircraft reshuffling resulting from the E175 deliveries.
In later years Alaska will boost frequencies and add some new destinations. The management does not see much international expansion, although the 737 MAX 9s would open up some opportunities (32 on firm order, deliveries from June 2019). The key message was that Alaska would mostly rely on partners internationally.
The expanded LAX and SFO presence led to a “huge increase in interest” from global partners to work more with Alaska. In the past six months, four of Alaska’s 15 airline partners have started or announced international service to Seattle, after previously receiving feed from Alaska only in California. Mileage Plan member accruals on global partners have nearly tripled over the past three years.
The investor day presentation included an interesting table showing that “Alaska Global Partners” now has a higher share of all long-haul international seats out of Seattle than SkyTeam (39% and 38%, respectively), and with more destinations. Similarly, Alaska’s partners now have a higher combined share of international seats from the entire West Coast than the average of SkyTeam, Star and oneworld (29% and 26%, respectively).
The partnerships are at most one-way codeshares (like JetBlue’s), with Alaska displaying the partner’s code but not vice versa. But they enable Alaska to offer its loyalty programme members a global network of over 900 destinations for earning and redeeming miles. It is all about retaining loyalty members and growing the lucrative programme. In that respect Alaska has an advantage over Southwest, which does not have global partners.
So Alaska is keen to deepen the cooperation and make it more seamless. Among other things, it will start selling its international partners’ fares on its website next year.
Alaska executives also mentioned that they were considering oneworld connect membership — a lower-cost category created this year for smaller carriers that has so far attracted Fiji Airways. The benefits are more extensive with member airlines that become “oneworld sponsors”. Eight of Alaska’s 15 partners belong to oneworld (including American, BA, JAL, Qantas, Cathay and LATAM).
Fleet decision
Alaska had no choice but to become a mixed fleet operator for many years, because the vast majority of Virgin’s Airbus aircraft are leased and it would have been “extraordinarily expensive” to terminate the leases early. In any case, Alaska needed the lift and having two mainline types offered useful flexibility for developing the post-merger network.
But a dual 737/A320 fleet makes little sense for a low-cost carrier in the long run, so Alaska is widely expected to go back to an all-Boeing fleet if it can do that without excessive added training costs or harming growth.
The topic was not discussed much at the November investor day, but the management did say that they expected to make the long-term fleet decision in 2019.
The fleet dis-synergies have been greater than originally anticipated. Alaska now estimates the added cost of a dual fleet to be “in the $40m range” annually, compared to $20-25m previously.
All but 10 of the 63 A319/A320s that Alaska acquired in the merger are leased. The vast majority of those leases expire in 2023-2025. Since the merger, Alaska has received the first eight of 10 A321neos that Virgin committed to leasing from GECAS, with the final two arriving in 2019.
Alaska also inherited an order for 30 A320neos from Airbus for 2020-2022 delivery that can be cancelled for just $15m.
Some in the financial community have speculated that Alaska will return the A319s and A320s as they come off lease but will keep the A321neos. The latter are ideally suited to the Hawaii market (and the current GECAS leases run through 2030 anyway).
Re-deleveraging success
One thing seems certain: Alaska will be successful in repairing its balance sheet after borrowing $2bn to finance the Virgin acquisition.
Before the merger Alaska was under-leveraged, having reduced its debt-to-capital ratio from 81% in 2008 to 27% in 2015. The Virgin financing caused the ratio to soar to 59%. The management announced plans to “re-deleverage” and set a target of 45% by 2020.
As of September 30, Alaska had paid off $800m of the Virgin-related debt and reduced the debt-to-capital ratio to 49%. It now expects a 41-43% ratio next year, thus achieving its target a year ahead of schedule.
With fleet growth moderating in the next two years, Alaska expects its total annual capex to decline from the past two years’ $1bn to the $750m-level in 2019-2020. Assuming profit growth, free cash flow should improve significantly.
Alaska is committed to “balanced capital allocation favouring conservatism”. The priorities are to fund growth, make scheduled debt repayments and pay dividends. The remaining operating cash flow will be available for either share buybacks or further debt reduction.
Filling the Virgin America gap
After the merger many people felt that the disappearance of the much-loved Virgin America product had created an opening for an edgy new entrant to shake things up in the increasingly consolidated US domestic market. Virgin Group’s founder Richard Branson, too, frequently hinted that he might launch a new Virgin brand airline in the US.
Two years on, new mainstream entry looks difficult. First, the gap may have been effectively filled by Alaska and other airlines. Second, industry consolidation and other structural changes have created a very tight market.
On transcontinental routes, JetBlue has filled much of the gap with its highly acclaimed Mint premium product offering, which it has expanded aggressively since the Alaska-Virgin America merger was announced.
The most price sensitive customers in the US now either fly on ULCCs or buy the basic economy fares offered by the legacies and Alaska; JetBlue and Hawaiian will introduce their versions in 2019. Those fares have really taken off and spread nationwide only in the last two years.
Better product segmentation has enabled the legacies to focus more sharply on improving their domestic premium offerings, raising the bar at the top end of the market.
But there is always room for an edgy niche operator. The only substantial new airline currently on the drawing board, JetBlue/Azul founder David Neeleman’s planned US start-up, arguably belongs to that category because it will focus mainly on point-to-point operations between secondary cities.
After long angling a return to the US with a new airline venture, Neeleman got his opportunity because of the availability of the A220 (formerly CSeries). The outstanding economics and passenger appeal of that aircraft type may facilitate a new type of profitable upmarket LCC business model.
| 2010-2018 | Airlines* | High Quality Industrials† | Alaska Air Group |
|---|---|---|---|
| Pretax margin | 10.4% | 13.0% | 15.1% |
| Free cash flow margin | 2.1% | 7.7% | 7.8% |
| ROIC | 13.6% | 14.8% | 16.7% |
| Adj. net debt/EBITDAR | 1.8x | 1.6x | 0.9x |
| P/E multiple | 13.9x | 18.6x | 10.7x |
Source: Alaska Air Group/Wells Fargo Securities
Notes: *Airlines: Delta, American, United, Southwest, JetBlue, Spirit, Allegiant, Air Canada and WestJet. †HQIs: UPS, Fedex, 3M, Caterpillar, Boeing, J B Hunt, United Technologies, Ryder, Union Pacific, Kansas City Southern, Norfolk Southern, Canadian National and Canadian Pacific.
| Number of aircraft at year-end: | |||||
|---|---|---|---|---|---|
| 2016 | 2017 | 2018 | 2019 | 2020 | |
| Mainline aircraft | 218 | 221 | 233 | 242 | 249 |
| Regional aircraft | 67 | 83 | 95 | 93 | 92 |
| Total aircraft | 285 | 304 | 328 | 335 | 341 |
| Total capex* | $678m | $1bn | $1bn | $750m | $750m |
Source: Alaska Air Group (November 27 presentation) * Aircraft and non-aircraft capex
| Category | Multi-year opportunity | 2019 target | Details |
|---|---|---|---|
| Remaining merger synergies | $235m | $130m | Cross-fleeting, loyalty growth, Airbus retrofits, global partners |
| Revenue initiatives | $240m+ | $200m | Saver Fare, higher bag fees, other ancillary initiatives,corporate sales |
| Operational efficiencies | $75m+ | ~25% | Productivity, schedule optimisation, guest self-service |
| Support function efficiencies | $85m+ | ~55% | Constraining overhead, vendor management, selling & distribution |
Source: Alaska Air Group
| Operating fleet | Firm orders | Lease commitments | Delivery schedule/ comments | |
|---|---|---|---|---|
| 737-700F | 3 | |||
| 737-700 | 11 | |||
| 737-800 | 61 | |||
| 737-900 | 12 | |||
| 737-900ER | 73 | 6 | ||
| 737 MAX 9 | 32 | From June 2019 | ||
| A319 | 10 | |||
| A320 | 53 | |||
| A321neo | 8 | 2 | 2019 | |
| A320neo | 30 | 2022-2024/cancelable | ||
| Total mainline | 231 | 68 | 2 | |
| Q400s | 41 | Operated by Horizon | ||
| E175s | 16 | 17 | 4Q18-2021/Horizon | |
| E175s | 32 | 3 | 2021 / SkyWest | |
| Total regional | 89 | 17 | 3 | |
| TOTAL FLEET | 320 | 85 | 5 |
Source: Alaska Air Group 10Q
Source: Alaska Air Group reports * Analysts' consensus estimates (December 4, 2018). Virgin America's results included since December 14, 2016.
UNIT REVENUES (US¢)
Source: Alaska Air Group and JP Morgan reports Notes: * CASM projections by Alaska management (mid-points of ranges); RASM forecasts by JP Morgan (November 28 report)
Note: †2019 targets are mid-points of ranges (41-43% and $1,700-1,800m). Debt = long term balance sheet debt including current portion.
Source: Alaska Air Group
Source: Alaska Air Group
Source: Alaska Air Group.
Notes: Stage length adjusted non-fuel CASM 12 months ended June 2018. US West Coast-originating flights to North American destinations.
Source: Alaska Air Group and analyst reports