Virgin America:
Back in the growth mode
December 2015

After halting growth for three years, becoming consistently profitable and completing a successful IPO in November 2014, Virgin America is ready to start growing again. The award-winning San Francisco-based LCC began taking A320 deliveries again in the summer and is anticipating “low-to-mid teens” ASM growth in 2016.
The move makes sense. First, Virgin America is still a young airline. Eight years old, with a fleet of only 58 aircraft (at year-end 2015) and a network of 23 cities, it will benefit from economies of scale and from being able to offer its business customers a broader range of destinations.
Second, Virgin America has now proved that it can be financially successful. Since becoming modestly profitable in 2013, the airline has increased its earnings significantly and is now achieving operating margins similar to those of other US carriers.
Third, Virgin America is better positioned for growth now that it has a stronger balance sheet and can access lower-cost financing — both a result of the IPO.
Virgin America has continued to outperform the industry in terms of passenger unit revenues (PRASM), despite being heavily exposed to competitive hotspots such as Dallas and the New York transcon markets.
This suggests that Virgin America’s blend of friendly, hip upscale service, high-tech offerings and competitive fares — always a huge hit in the marketplace — is gaining wider traction.
The PRASM outperformance also reflects success in finding a viable niche. Virgin America’s product has been keenly embraced by the typical younger Silicon Valley business travellers. And its California strongholds — the Bay area and the LA Basin — are among the nation’s most vibrant economies.
Next year’s outlook is promising. Virgin America’s leadership expects the RASM outperformance to continue, thanks to ancillary revenue growth and lucrative new markets such as Hawaii, while unit costs should benefit from the resumption of ASM growth.
But there is a wide divergence of opinion among analysts about Virgin America’s prospects. The average recommendation on the stock is currently “hold”, but there are as many “underperforms” as there are “strong buys”.
That may partly reflect Virgin America’s unusual business model. It is not easy to understand the concept of an airline having “premium revenue generation with an LCC cost base”, as Virgin America describes itself.
There are analysts who are impressed by Virgin America’s strong recent track record. They may have flown the airline and understand why it is loved by the travelling public.
But some analysts remain concerned about the limited network that is heavily exposed to competition from both network carriers and ULCCs (even though so far Virgin America has fared well in highly competitive markets). The main long term concern is about the extent of the growth opportunities for that type of business model.
The long road to the IPO
Virgin America is still here because of the patience of its initial investors, which had to recapitalise the company several times in the seven-plus years before it was able to go public.
The airline had an exceptionally tough time getting started and becoming viable. First, its start was delayed by two years due to questions about its ownership and control structure, so Virgin America launched in August 2007 into a tough economic environment (the 2008 oil price surge, followed by the global recession).
In 2009 one of Virgin America’s founding investors exercised an option to sell their stake back to the UK-based Virgin Group, which led to a new DOT enquiry about VA’s US citizenship status. The airline lost about a year of growth. After a successful recapitalisation and DOT clearance, Virgin America staged its “second take-off” in January 2010.
The airline then embarked on a growth spurt, taking 25 new aircraft and more than doubling its ASMs over three years. But net losses only widened. From 2008 up to and including 1Q2013, VA recorded net losses totalling $651m.
Virgin America also found its progress impeded by difficulties in obtaining gates and slots at desirable airports. It needed large primary markets to be profitable because of its upscale service and desire to attract business traffic.
In late 2012 Virgin America realised that it was in no position to start taking deliveries in mid-2013 of the 60-aircraft A320/A320neo order placed in January 2011. It renegotiated the contract with Airbus and halted ASM growth.
The A320 orders were reduced from 30 to 10 and deliveries rescheduled from 2013-2016 to 2015-2016 (currently under way). The 30 A320neo positions were deferred by four years to 2020-2022.
Thanks to the immediate positive results from the no-growth strategy, Virgin America’s investors agreed to another major financial restructuring in the spring of 2013. The shareholders wrote off $290m of the carrier’s debt in return for future stock purchasing rights and provided an additional $75m of debt.
Virgin America’s financial turnaround was a direct result of the late-2012 decision to halt ASM growth. The airline’s capacity fell by 2.2% in 2013, remained flat in 2014 and has inched up only by around 3.6% this year.
At the same time, though, Virgin America was able to strengthen its presence in key markets. It was a major beneficiary of the American-US Airways slot and gate divestitures, which enabled it to access Dallas Love Field and expand service at New York LGA and Washington DCA in 2014.
The new expansion posed a risk in a year when Virgin America effectively had to go public or face extinction. The original investors are believed to have made it clear that they would not bail out the company again.
But Virgin America executed the 2014 expansion well. The financial impact was favourable because the airline culled less profitable flying to free assets for the new services, which were typically in higher-yield business markets.
Virgin America was very lucky in that market conditions turned favourable for airline IPOs in late 2014. Oil prices had fallen sharply and, as a result, US airlines were headed for record profits and their share prices were soaring.
In its November 2014 IPO, Virgin America sold 13.3m shares to the public at $23 (at the higher end of the range), raising $307m and obtaining a listing on the NASDAQ. In a separate private placement, the controlling shareholders sold 2.3m shares to PAR Investment Partners for about $51m.
The IPO valued Virgin America at $994m (43.3m total shares), though by the end of the first day of trading the share price had soared to $30, valuing the company at $1.3bn.
The shares have performed relatively well. The price peaked at around $45 in late 2014 and early 2015, then fell in line with the industry trend to bottom out below $30 in May-July and has since August hovered at the $35 level.
Importantly, the original backers have stayed on board. After the IPO, Cyrus Capital Partners and the Virgin Group held 35% and 33% stakes, respectively, though the latter is limited to 25% of the voting rights. There were no changes to VA’s board.
But even more importantly, the IPO eliminated $690m of debt and boosted liquidity by $214m, giving Virgin America a decent balance sheet for growth.
Before the IPO, VA had $805m of total debt and a shareholders’ deficit of $334m. At year-end 2014, total debt was $130m and shareholders’ equity was $460m. The net debt/EBITDAR ratio improved from 6.2x before the IPO to 2.5x at the end of June. And unrestricted cash reserves in September stood at $512m — an ample 34% of LTM revenues.
Thanks to the IPO, the 10 A320s arriving from Airbus between mid-2015 and mid-2016 are Virgin America’s first owned aircraft. The carrier has funded 80% of their acquisition costs with long-term bank debt facilities that have a weighted average interest rate of less than 5% — clearly a much better deal than leasing. Of course, Virgin America is likely to secure even lower interest rates when it starts tapping the debt capital markets for aircraft financing (EETCs).
Healthy profits at last
While Virgin America’s revenue growth has been modest in the past two years, its profitability has improved significantly due to RASM outperformance, lower lease and interest costs and, of course, lower fuel prices. In 2014 operating margin rose to 8.1% and net profit surged to $84.4m. This year’s operating margin is expected to be 14-15% and the net profit around $208m.
In recent quarters Virgin America has closed the operating margin gap with its peers. Its third-quarter operating margin of 18.2% was at the low end of the range for the top 10 US carriers. The other nine airlines had margins ranging between 18.4% and 28.5%.
After curtailing growth, Virgin America quickly went from industry-laggard to an industry leader in unit revenue growth. It has outperformed the industry on PRASM in all but one or two quarters in the past three years.
In addition to the benefits from tight capacity, the PRASM outperformance has reflected the growing popularity of Virgin America’s product offering, success in capturing business and corporate traffic, and expansion in higher-yield markets.
At a recent investor conference, CEO David Cush presented DOT O&D Survey data that illustrated how well Virgin America fares when it competes head-to-head with other carriers. It has a significant unit revenue lead over other LCCs. In Q1 2015, in markets where it faced Spirit, Southwest and JetBlue, its weighted average PRASM was 190%, 125% and 116%, respectively, of the competitor’s PRASM.
VA also does well in head-to-head competition against Delta: both had the same PRASM. Its PRASM was a little lower than United’s, Alaska’s and American’s, but that was largely because the main competitive markets with those carriers were the JFK transcon routes.
The JFK transcon market has seen a major disruption in the past two years. Just about every other airline has put a new premium product there, and capacity has increased significantly. AAL and UAL now beat VA there in PRASM because they offer large first class cabins, lie-flat seats, etc.
But Virgin America has held onto its premium traffic and continues to make money on the JFK transcon routes. Its PRASM continues to exceed JetBlue’s, despite the latter’s new successful “Mint” premium product and a larger number of premium seats.
On the more “product-neutral” SFO/LAX-Boston routes, Virgin America achieved the second-highest PRASM in the market (after UAL’s).
Virgin America anticipates strong ancillary revenue growth in 2016, in part thanks to upgrades to its Sabre system that make it possible to price ancillary products dynamically.
Virgin America has done a good job in controlling non-fuel costs, but this year ex-fuel CASM is spiking due to higher labour and maintenance costs and a reduction in average stage length. The airline is in the process of bringing its pay and benefits closer to the levels of other domestic carriers. In April pilot pay was increased by 15% and other groups’ pay by 5-20%. But Virgin America has a highly productive workforce.
In June Virgin America’s pilots voted to join ALPA, which was not surprising as VA was the only US carrier left with non-unionised pilots. The flight attendants unionised in late 2014. It will mean cost pressures in the longer term (initial contracts take 3-6 years to negotiate).
The management expects ex-fuel unit costs to decline in 2016 as ASM growth resumes and more aircraft are purchased rather than leased.
The low-cost, high-amenity model
CEO David Cush recently described Virgin America as being “like the legacy carriers on the revenue side”. That means a high-quality product, a first class offering, corporate selling and distribution through the GDSs.
Cush has also said that Virgin America goes after legacy carriers’ premium revenues. Up to 40% of its revenues are believed to come from business travellers. In late 2014 the airline reportedly had agreements with 37 of the top 100 corporations in the US.
However, Cush also always stresses that a low cost structure is the key thing in the foundation of the company. He has suggested that, with the exception of Spirit, Virgin America is the “purest low-cost model” among the US LCCs.
VA has a simple production model: a single fleet type, young and fuel efficient aircraft, point-to-point operations, extensive outsourcing and high labour productivity. The management has indicated that they plan to stick to every aspect of that simple model, meaning that there will not be a second fleet type at Virgin America.
The simple production model gives Virgin America a significant CASM advantage over the legacy carriers. VA estimates that its CASM is 30-40% lower than the domestic unit costs of the full-service legacies it competes with.
Virgin America also views its cost structure as being competitive with the other US LCCs, if an adjustment is made for the near-100% leased fleet. On that basis, VA is “in the middle of the pack”, with CASM slightly higher than Southwest’s but similar to JetBlue’s.
Virgin America offers three classes of service — a premium in-flight experience that is consistent across the carrier’s entire fleet and network. The main cabin product is still considered to be industry-leading and continues to sweep the awards.
The key components of the product are an excellent in-flight entertainment system, very comfortable seats and pleasant and friendly flight attendants. Having pioneered in-flight Wi-Fi, the airline has just introduced significantly faster satellite Wi-Fi on 10 A320s. The business model leverages the Virgin Group brand, which is about high quality and innovation.
Network and growth plans
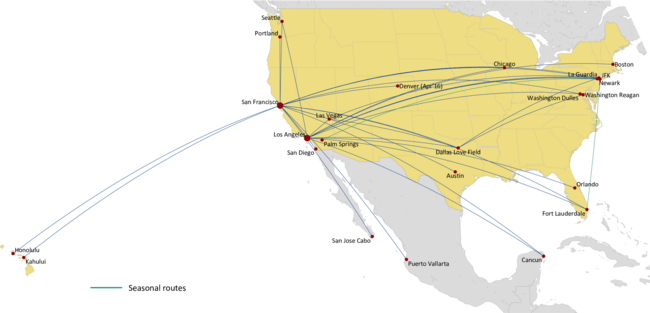
In recent years, largely thanks to airline mergers, Virgin America has finally been able to access some of the country’s largest business markets: Dallas Fort Worth (2010), Chicago O’Hare (2011), Philadelphia (2012), Washington DCA (2013), Newark (2013), LaGuardia (2014) and Dallas Love Field (2014); however, it has since pulled out of DFW and Philadelphia.
But, like other smaller carriers, Virgin America continues to face obstacles to further expansion at locations such as Chicago O’Hare and the New York airports.
Virgin America was able to add Dallas Love Field (DAL) as a mid-continent focus city after being allowed to purchase two gates from American-US Airways. It was a unique opportunity to access a slot and gate-constrained airport close to the city centre and benefit from the full expiration of the Wright Amendment restrictions on long-haul flights. VA transferred its services from DFW to DAL and launched flights to many business destinations.
The initial 12 months at DAL have been difficult because of Southwest’s extremely rapid expansion. VA has seen high-teens RASM declines there, though it has held its own thanks to its premium offerings. It is the only carrier to offer three classes of service at DAL.
This autumn’s highlight has been the launch of services to Hawaii, linking SFO with both Honolulu and Maui with daily flights using new ETOPS-equipped A320s. Virgin America is confident of its success in Hawaii because it has historically done well in such large, fragmented and highly competitive leisure markets. The Hawaii routes have yields similar to those in the New York transcon market but benefit from having primarily California-originating traffic (where VA’s strength is). Hawaii is also counter-seasonal to the rest of VA’s network.
After the recent years’ large-city additions, the management now feels that Virgin America has reached certain critical mass. As it expands further it can start reaping strong economies of scale and significant positive network effects.
The main thrust of VA’s future growth strategy is, first, to continue to stick to large markets and to focus on the US for the time being (VA also serves Mexico).
Second, Virgin America will be looking to add more business destinations. The next such city is Denver, from March 2016. Denver is the largest market from SFO that VA does not currently serve, a high-tech centre and the most requested new destination by the carrier’s corporate accounts.
Third, the airline feels that it has significant further growth opportunities in SFO and LAX. It still has only an 8-9% domestic market share out of its SFO home base and 5% out of LAX. Both are high-income areas where Virgin America has much brand recognition. Although after Denver it will have the 10 largest markets out of SFO covered, it does not yet serve 15 of the next 20 largest markets, with cities such as Orange County, Atlanta and Phoenix heading the list. The number of unserved large markets out of LAX is even greater.
Fourth, Virgin America can be expected to be quite disciplined about growth this time around. It wants to avoid the mistake it made in the pre-2013 days of having too much capacity in new or developing markets, which had a dire impact on profitability. The new limit is 10% of capacity in such markets, and growth decisions will have to meet strict ROIC criteria.
The company feels that a 10% long-term annual ASM growth rate will “optimise operational constraints, cost structure and revenue performance”. Two thirds of the growth will be in existing markets and one third in new markets.
Virgin America is also likely to rely more on airline partnerships. It expects to raise the percentage of revenues from codeshare and interline relationships from the current 5% to “closer to 10%” over time.
After receiving the 10 A320s from Airbus by mid-2016 (five this year, five next year), which will give it a 63-strong fleet, Virgin America will have a four-year gap in deliveries from Airbus until the A320neos start arriving in 2020. So the airline has been looking to lease or purchase A320s to facilitate growth in 2017-2019. VA has a strong preference for new aircraft because it feels that used aircraft could introduce a lot of complexity into the operation.
In mid-December Virgin America announced that it had agreed to lease ten new A321neos from GECAS for delivery between 1Q2017 and 3Q2018. It will be among the first airlines globally to operate the variant powered by CFM's LEAP-1A engines. VA was able to secure early deliveries as the aircraft are part of the lessor’s existing orderbook with Airbus. The larger A321neos (185 seats, 24% more than on VA’s existing A320s) will help in efforts to keep unit costs low. The airline plans to operate them on the Hawaii and key transcon routes.
Virgin America’s potential niche is clearly more limited than those of ULCCs like Spirit. But there would still appear to be lots of markets where its special brand, premium product and business model could work.
The airline believes that it is “in the middle of pack” in terms of pretax ROIC (18.8%) and intends to improve on that. But it would be perfectly okay for a young growth airline to lag its peers a little in terms of profit margins and ROIC.
Note: 2015 and 2016 revenue and profit forecasts by Bank of America Merrill Lynch (November 3)
Note: 2016 forecast based on mid-point of Virgin America's current 13-15% ASM growth projection.