British Airways: has the future arrived yet?
December 2002

In the March edition of Aviation Strategy we outlined British Airways' new strategy that the company had developed following September 11 — under the soubriquet of Future Size And Shape. Many aircraft have flown since the plan was first considered and implemented. We now review the company’s success in achieving objectives in the past eight months.
The prime objective of the strategy was to allow the company to return to profitability — with the target of a 10% margin by 2004 — with annual cost savings generated by the a year of £650m a year.
The main planks of the strategy involved cost reduction, a full restructuring of short haul operations and simplification of processes. The immediate element of the strategy was to cut manpower. Accruing to this was an acceleration of the existing fleet strategy and the further downsizing of operations at Gatwick. In addition, the company had finally discovered a possible strategic response to the incursion of low fares operators — especially necessary after the sale of Go.
Staff levels
For an airline the largest identifiable marginal cost is that of employees. Very quickly after September 11 BA announced job cuts of 7,500 (5,800 of which had gone by the end of December) out of its then staffing levels of 56,700 man–power–equivalents (mpe). In February it announced a further cut of 5,800 positions.
The company stated its intention of completing 10,000 of this reduction by the end of March 2003 and the whole 13,000 reduction in workforce by the end of March 2004.
By the end of September this year the company’s staff levels had fallen by 9,800 from the levels at the end of August 2001 (including some 1,400 from the sale of its subsidiary World Network Services). Usefully only 12% of these reductions came from early retirement and nearly 40% arose from natural wastage.
For the quarter ended September this year, staff costs were 15% down on the prior year levels. It appears that the company is well on target to achieve its stated plans.
Fleet and network restructuring.
Under "Future Size And Shape", the fleet strategy was unchanged but the implementation accelerated. As with any airline it takes time to get the behemoth that is the historic fleet to changed direction.
The fleet restructuring and simplification involves not just the short–haul fleet renewal (with the delivery of A320s to replace older short haul Boeings) but also the alignment of individual fleet types to reduce the number and complexity of the sub–fleets. Where the process is most notable is at Gatwick. The company finally gave up the idea of trying to make its Gatwick operations into a full hub. There it has just about completed the de–hubbing:
The number of destinations it serves from the airport has fallen from 95 to 49 (involving the transfer of 30 routes to Heathrow). It has aligned the fleet so that it now only operates three types instead of seven. Transfer traffic has fallen to 20%.
At the end of September the company operated some 349 aircraft, a net 24 down on the same time last year. In the period however, it disposed of eight older 747–200s, 18 757s acquired and returned two 777s and cancelled its 777 options, and disposed of eight 737s while acquiring a net 12 A320s and 3 regional jets. The fleet restructuring appears to be on track.
Since 1998 the company had been spending large amounts of cash on re–equipping its long haul fleet — through the acquisition of 777s and 747s to replace its ageing 747–200s. That re–equipment programme was over by the summer of 2001 — apart from a group of options for 777s. The airline had embarked on its short haul fleet renewal — through the acquisition of A320s. In any case the cash burn was due to fall dramatically. All other things being equal the company’s capital spend was due to fall from the average annual £2bn over the previous five years.
With further tweaking of the delivery patterns the average aircraft spend between 2003 and 2007 was now set to fall to an average of less than £250m a year.
Short-haul revamp
Not even in the US has any full service network airline really been able to create a satisfactory response to the point–to–point, no frills operator. The first reaction is to attempt to join them in their own game — as indeed BA did with the creation of 'go'. This palpably does not work — as BA finally accepted when it sold go last year — finding a significant level of traffic cannibalisation.
In the FSAS review, BA did come up with what could be the solution.
From the perspective of a traditional flag carrier, the problem dates back to the fully regulated era. Then it was deemed competitively unfair to offer discounts and it was assumed that people who wanted to take advantage of lower tariffs knew where they wanted to go and when they wanted to go far in advance. In addition, because of the historic prorate rules, transfer traffic was effectively granted the lowest available discounts that would otherwise be available on the open market. It is this loophole that the LCCs can effectively exploit.
The paradigm step–change comes from opening distribution channels that empower the consumer. Until even a few years ago, the traveller could only really get a price for a ticket by going to an agent (whose interest was in selling the highest price ticket), going direct to the airline (whose interest was in selling the highest price ticket), booking through an inclusive tour brochure (where the price would be hidden), or finding a bucket shop (from whom the ticket may not have been valid). Now, for the first time, with the internet there is a real opportunity for the consumer to find the best deal.
The other complication for the network carrier is the way that its capacity or yield management system works: altering the availability of capacity in various tariff bands on a daily b a s i s depending on current live booking data. As a result, the price of the lowest price tickets available for sale could fluctuate on a daily basis to the confusion and consternation of the consumer.
The strategic answer that BA found was to incorporate the LCC pricing model into the network operations. It completely revamped its online booking engine allowing the passenger online to find the best price for where he wants to go in a few easy steps. It slashed agency commissions to a very low per booking fee (£2.50) for short haul unrestricted fares. It introduced a £10 discount for passengers booking online (and a further discount for ticket less travel where available).
More importantly it started telling the consumer that there were cheap fares available comparable or better than the no frills competition — and telling them in the same language and in the same media ("we fly to A for prices from £X") — and included in the message the idea that fares would rise closer to departure. In addition it has dismantled some of the historic restrictions (such as the Saturday night stay requirement) where possible to bring its offering closer to that of the low fare competitors. This has meant a complete change in the algorithm of its inventory management for short haul unrestricted tariffs.
The new booking engine came on line in the spring, and the new commission levels took effect from June. The new lower fares without restrictions are now available on 176 routes through Europe. Since April the passenger use of Internet bookings has more than doubled. The usage of the online booking site BA.com has risen from 20% of the total in April to 34% by September.
The proportion of short haul bookings through the Travel Trade has fallen to 49% from 54%.
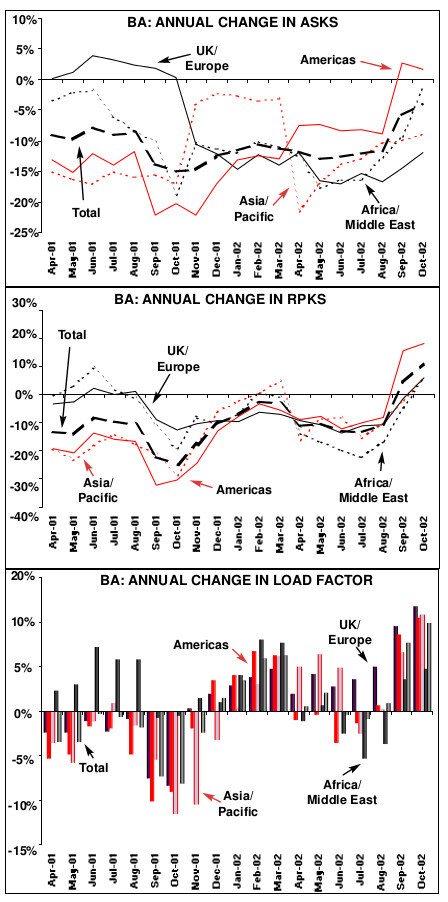
The short haul load factors have shown consistent improvement throughout the summer. The short haul yield has been improving with unit revenues throughout the summer with an average growth (excluding the anomaly of September) of 3.5%. In the second quarter of the financial year (the three months ended September) BA’s selling costs fell by nearly 9% year on year against a traffic revenue decline of 5%.
For the six months selling costs fell by 12% against a 7% decline in revenues.
Financial performance
For the quarter ended September 2002 BA produced a set of results and a positive surprise. Traffic fell by 7% in the quarter compared with prior year levels against a 10% decline in capacity and load factors improved by nearly 3 points. Unit revenues jumped by 5%. Total revenues fell by only 6.5% year on year. Overall unit costs fell by 6% and total costs fell by 15%.
Operating profit jumped to £248m (€389m) for the quarter compared with £72m in the previous year generating an operating margin of 12% — the best summer quarter margin since 1996. Operating cash flow in terms of EBITDAR (earnings before interest, tax, depreciation, amortisation and rentals) jumped by 40% to £486m and the pre–tax profit reached £245m up from a nominal £5m in the prior year period.
In the six months to September, the company has improved its liquidity position dramatically. Cash inflow from operations improved by £150m to £756m. The non operating cash outflow was limited to a net £18m compared with £557m last time.
This was helped by skipping last year’s dividend payment — but more dramatically, was affected by the fall in capital expenditure requirements and the disposal of assets. In February BA set itself a target of achieving asset sales of £500m by the end of March 2003. So far it has achieved £426m of this — mostly through the disposal of aircraft.
Cash at the end of September stood at £1.5bn (€2.36bn) up by £500m from September 2001 and up by £300m from March 2002, (and the company has additional committed facilities of £0.5bn).
On top of this the company has identifiable realisable assets of £2bn giving current liquidity of £4bn. Net debt peaked in December 2001 at £6.5bn — and has been reduced by more than £1bn to £5.5bn.
The results were positively received by the financial community — and allowed analysts to increase forecasts to show profitability for the current financial year.
Outlook
In the short term BA’s strategy appears to be working. For the first time for two years (well before the events of September 11) the fundamental direction of the finances appears to be right: there is a positive gap between the change in unit revenues and unit costs and the capital spending programme has been slashed from historic levels.
While the world’s economy is in the doldrums and more specifically the aviation industry is suffering its worst downturn in traffic and results, BA appears to be getting its house in order. In the longer run there may be more doubt. If it does succeed it will be the first airline that has quickly and efficiently been able to shrink into profitability.
So far the short haul strategy appears to be working to a certain extent.
However there is still a long way to go before BA gets close to achieving its group financial targets. In addition the ever threat of war in the Middle East adds significant operational uncertainty. Meanwhile, the low fares competition is growing very strongly and their aggressive marketing innovations may make BA’s attempts to return its short haul operations to profitability short lived. In the FSAS review the company looked at and rejected the "BOAC option" of returning the airline solely to a long haul operator.
If this attempt to beat the no frills operators at their own game fails — the company may well have to revisit the idea.
| April 02 | Sept 02 | ||||||
| Travel trade | 54% | 49% | |||||
| BA.com | 20% | 34% | |||||
| Contact BA | 17% | 11% | |||||
| Other direct | 9% | 6% | |||||
| Total | 100% | 100% | |||||
| 3 months to September 2002 | 6 months to September 2002 | |||
| 2002 | Ann change | 2002 | Ann change | |
| Revenues | £2,104 | -6.5% | £4,156 | -8.6% |
| Operating profit | £248 | 244.4% | £406 | 232.8% |
| Pretax profit | £245 | Nm | £310 | 588.9% |
| Unit Revenues | 5.09 | 4.9% | 5.08 | 5.4% |
| (p/ASK) | ||||
| Unit Costs (p/ATK) | 32.89 | -6.1% | -0.043 | -4.3% |
| Traffic (RPK) | 27,301 | -6.8% | 51,980 | -10.3% |
| Capacity (ASK) | 35,608 | -10.1% | 70,628 | -12.4% |
| Load Factor | 76.7% | 2.8pts | 73.6% | 1.7pts |