Post-September 11 market: the finance gap conundrum
December 2001

Two and half months on from September 11, Aviation Strategy reviews what has happened to global supply and demand, and looks at some of the implications for the financial basis of the industry.
For the moment, we are sticking with the same regional traffic forecasts as originally made in October, which equate to a 6% global decline in RPKs this year and 5% next before a substantial (17%) rebound in 2003 restores the long–term growth trend.
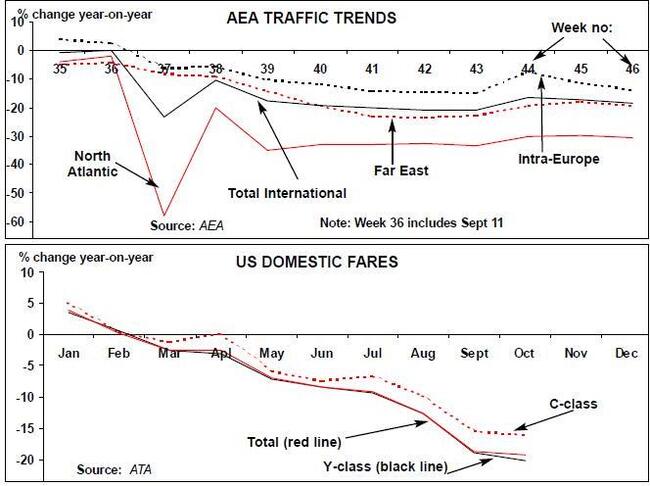
There are two main reasons for this cautious view. First, traffic, having originally perked up, is not yet showing signs of a sustained recovery. According to the AEA’s weekly reports, intra–Europe traffic is stuck at about -10% and intercontinental traffic at about -20% (and that is before factoring in the effects of Sabena’s and Swissair’s bankruptcies). There is a similar pattern in the US, and during the Thanksgiving holiday, a major test of discretionary travel, business was estimated by the ATA to be 20% below that of last year. And the unexpected element in the global equation is the poor performance of Asia/Pacific traffic where the September 11 effect has combined with the downturn in the major economies, particularly Japan’s.
The other consideration has to be the economic outlook. The OECD’s latest forecast, made in November shows the US slipping into recession and the Japanese recession deepening. The European economies look better, but still with insipid growth rates next year.
Nevertheless, there may be reasons for optimism, which are not showing up in the numbers yet. The news flow from Afghanistan has been surprisingly positive, and a semblance of normality has returned. Memories do fade, in the process lowering the psychological barriers to flying.
It is likely that we will revise the forecast in the near future, bringing forward the timing of the recovery in 2002, and smoothing down the 2003 rebound. But, as far as the financial health of the industry is concerned, traffic is not the only thing to worry about — yields have also collapsed.
The ATA’s Domestic Fare Report Fare report makes disturbing reading — accelerating a trend that was apparent before September 11, business class fares were down 16% in October against a year ago and 20% down for economy class. Similar yield declines are reported by European and Asian carriers.
It is difficult to see how the network carriers can extricate themselves from the downward yield spiral in the short term Their priority has to be get their passengers flying again even if they have to bribe them back onto aircraft. And they cannot afford to lose further market share to the low cost airlines by visibly pushing up fares.
(Incidentally, the other winners in this market may prove to be the express parcel carriers — FedEx, DHL, UPS — who are picking up business from the network carriers as they have to abandon bellyspace cargo, partly because of security concerns, partly because of their overall downsizing).
Financial outlook - ouch!
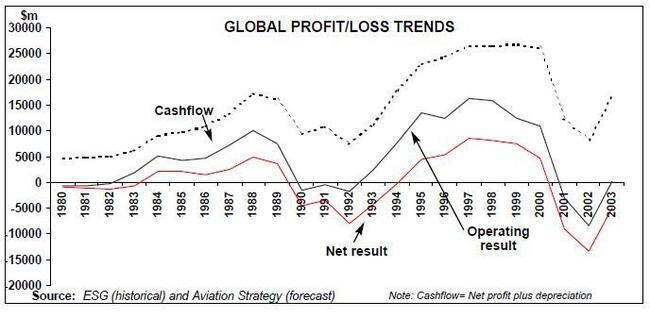
Incorporating the yield decline into the forecast provides a rough indication of the global financial impact of this crisis on the industry (as before the historical numbers are based on ICAO and borrowed with thanks from ESG/Airline Monitor). The key assumptions that we have plugged in are an 8% fall in passenger yield this year and a further 5% next year (remembering that for the first eight months of 2002 the comparison is being made against a "normal" period). In 2003 yields come back but are still below 2001 levels.
The unit cost side is even more difficult to estimate. Airlines are cutting into their cost bases by laying off employees and renegotiating leases and other financial arrangements, but they are also grounding aircraft, with the overall effect that the reduction in capacity is matching the reduction in costs, resulting in little change in unit costs (or even an increase, as American Airlines has experienced). We have opted for a 3% drop this year and next, partly because of the softness of fuel prices. In 2003 the unit cost change is zero.
What all this implies in terms of financial results in shown on the chart above. This year operating losses could total $3bn and total net losses $9bn (or even more if airlines decided to dump all the bad news in this exceptional year). Next year is even worse with record losses expected on the basis of our traffic, yield and cost assumptions. 2003 sees a return to break–even or close to it. It is interesting to note that throughout this period the industry remains cash positive.
Delivery riddle
Nowhere near cash positive enough, however, to be able to accept the new aircraft due for delivery next year. Pre- September 11, some 1,300 units were scheduled for delivery in 2002. We are now estimating a 40% reduction on that figure to around 800 deliveries to operators (airlines and lessors).
This supply side adjustment results from cancellations (relatively few so far and mostly associated with bankrupt airlines), deferrals (just about everyone is trying to negotiate deferrals not just for 2002 but also for deliveries in the mid–00s), and through deliveries diverted into Special Purpose Companies (SPCs).
These SPCs come in various forms but, for example, they can be set up by the manufacturer in conjunction with the airline customer, which has an obligation to take the aircraft it has order but cannot afford to take delivery in the current market. The SPC arranges for the aircraft to be delivered directly into parking facilities in the desert and pays for the parking costs. However, the airline customer has an obligation to take over the aircraft within an agreed timescale and, of course, to compensate the manufacturer. The price of the aircraft is set to escalate through this time period, so providing an incentive for the airline to accept delivery as soon as is feasible.
The question is: when will all these deliveries be deferred to? We are, very tentatively, predicting a major upturn in deliveries in 2003, the year when traffic rebounds. The 1,500 units includes both deliveries directly off the production lines and the final delivery of aircraft that had been temporarily parked to their owners.
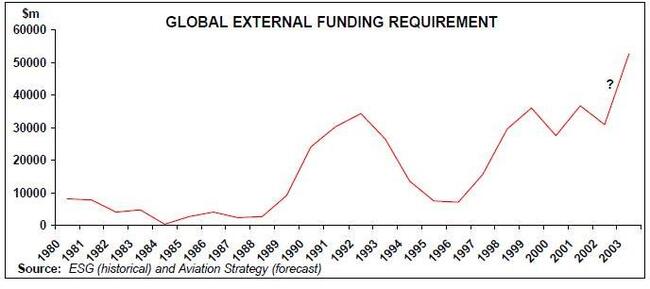
This has important implications for the aviation financial community in terms of the amount of external funding required by airlines. External funding is defined as the difference between the industry’s internal cashflow and its capital expenditure on aircraft and other equipment — the trend is shown on the graph on page 5.
Because of the combination of greatly weakened internal cash flow and the accumulation of planned and deferred deliveries, the theoretical external funding requirement balloons to a record $50bn in 2003. But will the financial community supply the capital?
It seems unlikely. Credit committees at investment banks will be casting very sceptical eyes over any aviation proposal. The aviation departments of many banks will be fully occupied trying to sort out problems with their client airlines. Many of the old precepts — such as the notion that a European flag–carrier would be allowed to go bust — have been undermined. Indirect investors who were attracted into the industry through tax–effective products like EETCs and JOLs will be wondering what their real exposure is. The European Credit Agencies should be worrying about having to reveal how much taxpayers' money has been committed to support sales of Airbus equipment to developed world purchasers.
Fate of the lessors?
Back in the last recession in the early 90s, the demise of GPA resolved the conundrum of the so–called financial gap. And, as its orderbook was wound down or sold off, balance in the aircraft market was gradual restored. Could something similar happen today?
Gecas and ILFC are backed by financially very strong parents, though AIG, the insurance giant that owns ILFC, has been rocked by September 11. The others are more fragile financially.
Just looking at the lessee list opposite reveals, hardly surprising, more weak than strong airlines. Some — Air New Zealand, Ansett, Canada 3000, Swissair, Sabena — are already in some form of bankruptcy; others — US Airways, America West, Olympic, Asiana, etc. — are looking shaky.
Their delivery commitments up to the end of next year are shown below. Where the operator is also a leasing company, this means that either the scheduled delivery has not been committed to an airline, or that ACAS cannot identify the lessee.
| Operator | ILFC | Gecas | Flightlease | Pembroke | Bouillon | SALE | Awas | Total |
|---|---|---|---|---|---|---|---|---|
| ILFC | 43 | 43 | ||||||
| Gecas | 41 | 41 | ||||||
| Flightlease | 12 | 12 | ||||||
| Air Canada | 7 | 4 | 11 | |||||
| Pembroke | 10 | 10 | ||||||
| American Trans Air | 9 | 9 | ||||||
| LTU | 6 | 3 | 9 | |||||
| Virgin Blue | 7 | 7 | ||||||
| WestJet | 7 | 7 | ||||||
| Air France | 6 | 6 | ||||||
| Emirates | 3 | 2 | 5 | |||||
| Frontier | 0 | 5 | 5 | |||||
| USA 3000 | 5 | 5 | ||||||
| Others (31 operators) | 31 | 11 | 4 | 3 | 8 | 2 | 2 | 61 |
| Total | 112 | 73 | 19 | 13 | 8 | 4 | 2 | 231 |
| Operator | Gecas | ILFC | Awas | Debis | Pembroke | Boullioun | SALE | Flightlease | TOTAL |
|---|---|---|---|---|---|---|---|---|---|
| Continental | 57 | 11 | 68 | ||||||
| Air France | 15 | 19 | 5 | 5 | 3 | 47 | |||
| US Airways | 45 | 45 | |||||||
| Gecas | 43 | 43 | |||||||
| TWA | 15 | 16 | 5 | 4 | 40 | ||||
| America West | 16 | 6 | 1 | 9 | 4 | 36 | |||
| Air Canada | 28 | 7 | 35 | ||||||
| TAM | 3 | 16 | 4 | 6 | 29 | ||||
| Swissair | 18 | 9 | 27 | ||||||
| Aeromexico | 16 | 5 | 2 | 23 | |||||
| Delta Express | 22 | 22 | |||||||
| Air New Zealand | 5 | 10 | 3 | 2 | 1 | 21 | |||
| bmi | 5 | 10 | 6 | 21 | |||||
| Varig | 15 | 4 | 2 | 21 | |||||
| Iberia | 2 | 16 | 1 | 1 | 20 | ||||
| KLM | 8 | 12 | 20 | ||||||
| Canada 3000 | 4 | 12 | 2 | 18 | |||||
| Mesa | 17 | 17 | |||||||
| Northwest | 17 | 17 | |||||||
| Olympic | 13 | 3 | 1 | 17 | |||||
| China Eastern | 14 | 1 | 1 | 16 | |||||
| Asiana | 3 | 10 | 1 | 1 | 15 | ||||
| Frontier | 10 | 3 | 2 | 15 | |||||
| American | 14 | 14 | |||||||
| Korean | 10 | 2 | 2 | 14 | |||||
| Virgin Atlantic | 6 | 7 | 1 | 14 | |||||
| Air 2000 | 6 | 3 | 3 | 1 | 13 | ||||
| Delta | 6 | 7 | 13 | ||||||
| ILFC | 13 | 13 | |||||||
| JMC | 6 | 7 | 13 | ||||||
| Rio Sul | 5 | 7 | 1 | 13 | |||||
| Ansett Australia | 1 | 1 | 10 | 12 | |||||
| China Southern | 9 | 3 | 12 | ||||||
| Dragonair | 12 | 12 | |||||||
| Sabena | 4 | 3 | 1 | 4 | 12 | ||||
| Air Jamaica | 3 | 4 | 2 | 2 | 11 | ||||
| Britannia | 11 | 11 | |||||||
| Mexicana | 5 | 4 | 2 | 11 | |||||
| Alaska | 3 | 7 | 10 | ||||||
| Lanchile | 4 | 6 | 10 | ||||||
| Malev | 5 | 3 | 2 | 10 | |||||
| Others (214 operators) | 241 | 249 | 66 | 42 | 36 | 21 | 18 | 8 | 681 |
| Total | 687 | 495 | 107 | 92 | 60 | 37 | 31 | 23 | 1,532 |
Note: Where the operator is also a lessor, this means either aircraft off-lease or airline not identified