US airlines all together - for now
December 1997

Third quarter 1997 produced excellent results for US airlines — $1.9bn against $1.2bn for the same quarter of 1996 — underpinned primarily by firm demand and lower fuel costs. Whether the US majors can sustain this improvement through the fourth quarter and beyond depends, as ever, upon whether airlines remain united on commissions and fares, or whether any of them breaks rank.
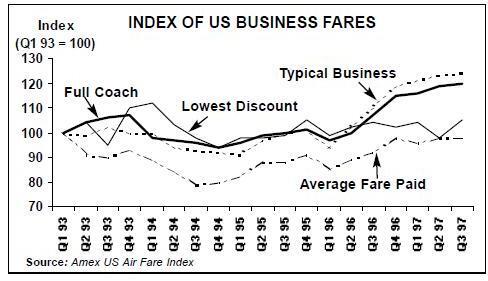
This year the US market has been characterised by high business fares, as revealed in the American Express domestic business airfare survey. Aviation Strategy has converted Amex’s survey of business fares on 215 US city pairs into an index, with a base of 100 in the first quarter of 1993. The index shows that in the last 18 months full coach (defined as unrestricted economy class fares booked in Y class) and typical business (the lowest economy fare available to the business traveller) have increased significantly. On the other hand the lowest discount (the lowest, most restrictive fares, which leisure travellers usually buy) have stayed broadly level over the last 12 months.
Higher business fares and static leisure fares are evidence that leading US airlines use increasingly sophisticated yield management techniques. In November United ran its first yield management and seat forecasting calculations based on IBM’s Deep Blue computer system. This conjures up the image of future US competition being waged between super–computers. More prosaically, United claims that Deep Blue will raise revenues by $50- 100m per year, which sounds impressive but actually equates to 0.3–0.6% of United’s annual turnover.
There are other significant factors at play in the trend towards higher US fares. A key external factor has been the federal government. The 10% federal ticket tax lapsed in January 1996, was reinstated in August 1996, lapsed again in January 1997 and was reinstated yet again in March 1997. Not all the tax was immediately passed on to travellers, but since March fares have steadily crept upwards. Most significantly, in September Northwest increased unrestricted fares by 5%, and most other airlines soon followed. The industry somehow arrived at an unofficial consensus of higher fares all round. And the upward trend seems to be continuing until the end of this year — the US Labor Department reported domestic airline fares rose 3.8% in October, the largest increase since March.
The industry’s hope is that this consensus will continue into 1998, with discounts and sales limited to restricted leisure tickets. Predictably, business travellers have been complaining about the rising fares, but with industry consensus they have had little option but to pay the higher fares. With a strong US economy (six years of uninterrupted growth) fuelling demand, there has been an impressive rise in domestic passenger traffic — US majors' domestic load factor rose from 65.7% in 1995 to 68.5% in 1996, and is topping 70% so far this year (see page 20).
However, not all airlines have yet been able to convert the new fare structure into higher average yields. For the industry as a whole net yields were down by 3% in the third quarter compared to 1996. The temptation is still there for some airlines to go for traffic growth and steal market share at the expense of yields in the search for profit.
The good news is that in September most US airlines cut domestic travel agent commissions from 10% to 8%. Many travel agents were outraged, but the move is indicative about how bullish (and consensual) the airlines are. Together, higher fares and load factors, and lower commissions and fuel prices, will lead to even better fourth quarter results, analysts predict.