Cargo airlines and the Chapter 3 dilemma
December 1997

Airlines will have to reconsider their freighter fleet strategies as the world airfreight market continues to grow at a faster rate than world passenger traffic. So can the imposition of Chapter 3 noise regulations in the US in the year 2000 and Europe/Asia in 2003 be turned to the advantage of cargo airlines?
In 1995–2004 world passenger traffic is forecast to grow at 5.5% p.a., according to Boeing, but airfreight traffic will grow at 6.7% p.a. IATA is even more bullish, and has just predicted that airfreight traffic will grow at 7.5% p.a. during 1997–2001, compared with its scheduled passenger forecast of 6.6% growth p.a. in 1997–2001.
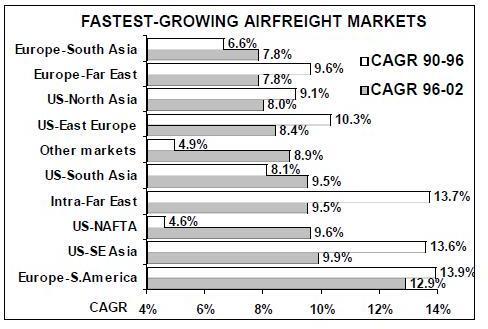
According to the latest forecast by USbased cargo consultants MergeGlobal, world airfreight growth is expected to average 7.1% p.a. over 1997–2002. MergeGlobal has the best handle on actual airfreight traffic, having compiled a database from various sources on an "originated weight" basis. This eliminates the double counting — such as between a shipper and a forwarder — which bedevils analysis of this sector. A detailed analysis by route region is shown in the table opposite and in the graph on the right.
Freighter fleet effects
So how will the forecast growth in world airfreight affect demand for freighter aircraft? The world’s freighter fleet is undoubtedly the poor relation of the passenger fleet. Once they have been utilised to their maximum, many former passenger aircraft end their useful life as freighters. As a result the global freighter fleet is older, more polluting and noisier than the global passenger fleet.
Worldwide, about 57% of the freighter narrowbody fleet and 22% of the freighter widebody fleet was still Chapter 2 as of the end of 1996 (see table below). European airlines generally have a higher compliance rate than the US carriers.
Chapter 3 noise legislation (2000 in the US, 2003 in Europe and most of Asia) therefore poses a major problem for the freight airlines. But it could also be seen as an opportunity to upgrade fleets, for example, by trading up from non–compliant narrowbodies to widebodies, in the expectation of achieving lower unit costs.
This strategy could be encouraged by the fleet policies of the world’s passenger airlines. Traditionally, many passenger airlines have viewed belly lift as having little or no marginal cost — it is just space below passengers, and consequently any revenue derived from the belly is incremental profit. Freighter airlines, on the other hand, must cover all their costs per flight in order to remain viable.
But belly lift is not forecast to rise as rapidly as the overall airfreight market, not just because of the slower passenger growth rate but also because most passenger airlines now focus much more on their core competency — carrying passengers. Belly lift is seen increasingly as a distraction, despite the incremental revenues it produces, as carriers build up hubbing systems or point to- point operations that rely on swift turnarounds.
Various other trends are curtailing the supply of belly capacity:
- Downsizing, notably the shift from 747s to smaller twin–jets on the Atlantic.
- "Right–sizing", for example, switching to 767–300s which offer 25% less seating capacity than an MD–11 but almost 50% less belly space.
- Pioneering ultra–long–haul operations using 747–400s, which have minimal cargo capability despite the size of the aircraft.
As incrementally–costed belly lift diminishes as a percentage of world airfreight, so the industry cost structure must inevitably rise as carriers add all–cargo capacity. Even the most efficient freighter operator using the cheapest converted aircraft has higher allocated costs than a belly carrier.
Yield improvements
These higher average unit costs should slow or even reverse the long term decline in cargo yield (2.5% p.a. in real terms over the past 25 years). Further improvements in industry yield may result from marginal players being forced out by the noise legislation, as the cheapest solution — the hush–kit — still costs several times the market value of first–generation jets.
For both the belly and freighter operators these trends promise increased profitability. They will also lead to a strengthening in the position of the market leaders who have the financial resources to cover capital expenditure.
As usual, the integrators are well positioned. FedEx’s fleet is now about 67% Chapter 3, and the hush–kitting of the remaining 727s plus deliveries of new A300/310s and MD11Fs will mean that it will meet the noise deadlines without problems.
UPS is now 100% Chapter 3 and has 757PFs and 767–300ERFs on order. The third largest cargo carrier, Atlas Air, is planning to increase its 747–400F order book from 10 to 11. The extra aircraft would join the four 747–400Fs which are currently scheduled to be delivered in 1998.
In October 1997 Cargolux Airlines ordered five 747–400Fs at a cost of $825m, to be delivered during October 1998- October 2001. Three of these will replace 747–200s and two will be used to increase capacity. In addition, the airline has also just taken delivery of another previously unannounced 747–400F.
For the next tier of cargo carriers the problems will be finding suitable conversion candidates among the 747–200s, TriStars and DC–10s on today’s strong second–hand market.
| 1990 | 1991 | 1992 | 1993 | 1994 | 1995 | 1996 | 1997F | 1998F | 1999F | 2000F | 2001F | 2002F | |
|---|---|---|---|---|---|---|---|---|---|---|---|---|---|
| US domestic | 4,352 | 4,621 | 4,921 | 5,232 | 5,802 | 6,090 | 6,386 | 6,692 | 7,003 | 7,732 | 7,804 | 8,307 | 8,891 |
| US-Africa | 22 | 25 | 27 | 28 | 31 | 34 | 35 | 38 | 41 | 45 | 49 | 53 | 57 |
| Africa-US | 13 | 11 | 13 | 16 | 20 | 22 | 21 | 22 | 24 | 25 | 26 | 28 | 29 |
| US-Middle East | 57 | 73 | 71 | 79 | 74 | 77 | 93 | 102 | 111 | 122 | 132 | 140 | 149 |
| Middle East-US | 32 | 28 | 39 | 45 | 53 | 54 | 57 | 61 | 65 | 70 | 74 | 79 | 84 |
| US-CIS | 4 | 5 | 11 | 21 | 23 | 21 | 24 | 25 | 27 | 29 | 31 | 33 | 36 |
| CIS-US | 1 | 1 | 1 | 2 | 3 | 4 | 4 | 4 | 5 | 6 | 6 | 7 | 7 |
| US-East Europe | 12 | 14 | 15 | 19 | 20 | 23 | 24 | 26 | 29 | 32 | 35 | 38 | 42 |
| East Europe-US | 11 | 8 | 7 | 11 | 13 | 15 | 17 | 18 | 19 | 20 | 22 | 23 | 25 |
| US-Cnt. Am./Cbn | 86 | 92 | 94 | 95 | 94 | 105 | 101 | 105 | 108 | 113 | 117 | 123 | 128 |
| Cbn/Cent. Am.-US | 125 | 125 | 129 | 133 | 146 | 145 | 153 | 158 | 164 | 169 | 174 | 179 | 185 |
| US-NAFTA | 264 | 203 | 216 | 213 | 267 | 313 | 341 | 373 | 413 | 457 | 504 | 554 | 607 |
| NAFTA-US | 78 | 57 | 58 | 58 | 70 | 87 | 106 | 114 | 122 | 132 | 145 | 156 | 169 |
| US-North Asia | 361 | 372 | 391 | 435 | 507 | 642 | 674 | 717 | 774 | 874 | 982 | 1,094 | 1,224 |
| North Asia-USA | 455 | 498 | 482 | 547 | 613 | 644 | 702 | 742 | 787 | 828 | 873 | 916 | 960 |
| US-South America | 167 | 194 | 228 | 234 | 267 | 296 | 292 | 312 | 334 | 362 | 391 | 422 | 456 |
| South America-US | 263 | 263 | 277 | 301 | 325 | 345 | 375 | 391 | 409 | 428 | 449 | 469 | 489 |
| US-Southeast Asia | 86 | 94 | 105 | 122 | 142 | 172 | 206 | 222 | 249 | 278 | 310 | 344 | 380 |
| Southeast Asia-US | 114 | 114 | 126 | 148 | 183 | 202 | 222 | 245 | 269 | 294 | 321 | 348 | 377 |
| US-South Asia | 13 | 11 | 14 | 15 | 16 | 24 | 26 | 30 | 34 | 39 | 44 | 50 | 57 |
| South Asia-US | 60 | 59 | 77 | 86 | 91 | 83 | 91 | 99 | 108 | 116 | 126 | 135 | 145 |
| US-SW Pacific | 55 | 55 | 61 | 64 | 77 | 85 | 87 | 87 | 91 | 95 | 99 | 104 | 108 |
| SW Pacific-US | 24 | 22 | 23 | 25 | 30 | 32 | 34 | 36 | 38 | 40 | 42 | 44 | 46 |
| US-West Europe | 712 | 746 | 776 | 746 | 813 | 913 | 969 | 1,033 | 1,123 | 1,209 | 1,297 | 1,387 | 1,479 |
| West Europe-USA | 617 | 549 | 573 | 653 | 809 | 863 | 899 | 941 | 984 | 1,042 | 1,108 | 1,168 | 1,229 |
| Europe-Africa | 340 | 336 | 355 | 344 | 357 | 382 | 407 | 431 | 458 | 486 | 517 | 549 | 583 |
| Africa-Europe | 155 | 141 | 178 | 164 | 174 | 185 | 198 | 213 | 225 | 240 | 256 | 272 | 288 |
| Europe-Cent. Am. | 51 | 62 | 76 | 83 | 83 | 88 | 94 | 101 | 107 | 117 | 126 | 136 | 147 |
| Cent. Am.-Europe | 56 | 67 | 85 | 93 | 98 | 103 | 110 | 116 | 123 | 133 | 143 | 153 | 163 |
| Europe-South Am. | 65 | 68 | 86 | 106 | 129 | 157 | 174 | 195 | 224 | 258 | 296 | 340 | 388 |
| South Am.-Europe | 48 | 52 | 57 | 50 | 60 | 68 | 73 | 80 | 88 | 97 | 106 | 115 | 124 |
| Europe-Far East | 445 | 462 | 509 | 591 | 713 | 781 | 859 | 945 | 1,025 | 1,116 | 1,212 | 1,310 | 1,413 |
| Far East-Europe | 603 | 711 | 749 | 775 | 810 | 893 | 961 | 1,038 | 1,109 | 1,189 | 1,270 | 1,353 | 1,439 |
| Europe/Middle East | 223 | 253 | 294 | 298 | 303 | 327 | 355 | 384 | 416 | 451 | 489 | 530 | 574 |
| Middle East-Europe | 203 | 205 | 170 | 178 | 180 | 183 | 189 | 198 | 205 | 214 | 223 | 234 | 245 |
| Europe-South Asia | 72 | 53 | 63 | 72 | 88 | 89 | 96 | 104 | 112 | 121 | 130 | 141 | 152 |
| South Asia-Europe | 106 | 109 | 132 | 131 | 150 | 157 | 165 | 181 | 194 | 209 | 225 | 241 | 258 |
| Europe-Canada | 125 | 121 | 116 | 119 | 126 | 131 | 135 | 144 | 151 | 159 | 167 | 175 | 183 |
| Canada-Europe | 89 | 87 | 93 | 83 | 78 | 83 | 85 | 89 | 92 | 95 | 98 | 101 | 104 |
| Europe-SW Pacific | 78 | 67 | 70 | 74 | 89 | 100 | 107 | 114 | 122 | 131 | 139 | 148 | 157 |
| SW Pacific-Europe | 73 | 80 | 80 | 68 | 72 | 78 | 82 | 86 | 92 | 96 | 101 | 106 | 111 |
| Intra-Asia | 1,100 | 1,190 | 1,329 | 1,475 | 1,800 | 2,097 | 2,374 | 2,624 | 2,846 | 3,099 | 3,387 | 3,719 | 4,100 |
| Intra Europe | 832 | 827 | 848 | 892 | 954 | 982 | 1,013 | 1,045 | 1,082 | 1,121 | 1,165 | 1,214 | 1,267 |
| Other regions | 1,517 | 1,420 | 1,427 | 1,591 | 1,839 | 2,025 | 2,198 | 2,375 | 2,571 | 2,799 | 3,051 | 3,339 | 3,657 |
| TOTAL | 14.2m | 14.5m | 15.5m | 16.5m | 18.6m | 20.2m | 21.6m | 23.0m | 24.6m | 26.3m | 28.2m | 30.3m | 32.7m |
| Chap 2 | Chap 3 | Total | % Chap 3 | |
|---|---|---|---|---|
| Widebodies | ||||
| Europe | 1 | 33 | 34 | 97% |
| North America | 57 | 166 | 223 | 74% |
| Asia | 4 | 57 | 61 | 36% |
| Other | 14 | 10 | 24 | 36% |
| Total | 76 | 264 | 340 | 78% |
| Narrowbodies | ||||
| Europe | 38 | 80 | 118 | 68% |
| North America | 403 | 366 | 769 | 48% |
| Asia | 14 | 10 | 24 | 42% |
| Other | 157 | 10 | 167 | %6 |
| Total | 612 | 466 | 1,078 | 43% |