Harmonious hubs and discordant politics
December 1997

European airlines have finally evolved proper hubbing systems at their main bases, and are now enjoying the benefits of enhanced traffic growth and record load factors. (9.2% growth in international traffic in September and 77% load factors). So how will competition and cooperation between hubs evolve from here?
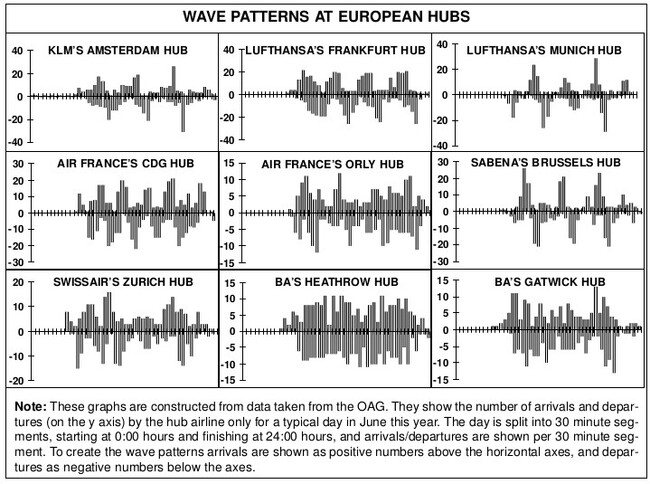
Europe thought of hubs as competitive weapons well before the Americans, but the early hubs were sixth freedom operations taking advantage of geographical positions at Amsterdam or Brussels and exploiting historical traffic rights. The new European hubs have imported post–deregulation US logistics, specifically the arrival and departure wave systems.
The graphs opposite reveal the incumbent carriers' three or four wave patterns at their main European hubs. The more harmonious the pattern — at Amsterdam, Frankfurt, Munich and now Paris CDG — the more dominant the hub system. Airports like Heathrow, where the pattern simply looks like noise, are too congested to operate a wave system.
Multi-hub systems
The Star Alliance and the Atlantic Excellence Alliance are now operating multiple hub systems on both sides of the Atlantic: Frankfurt/Munich/Copenhagen/Chicago/ Washington Dulles/Los Angeles/Montreal and Zurich/Brussels/Vienna/Atlanta/Cincinnati respectively. Through connections at hubs both in North America and in Europe these alliances have already built broad networks and generated strong growth. This is making it difficult for an intercontinental airline to survive at a competing alliance hub — hence Delta’s downgrading of operations at Frankfurt.
In recent times KLM has been the European leader in hub building, developing a four wave system at Schiphol in cooperation with its US partner Northwest but it evidently feels exposed by having only one hub in Europe. With another European hub, KLM and Northwest — with its three hubs at Minneapolis, Detroit and Memphis — could increase their services exponentially, and ease pressure on Schiphol airport where capacity constraints are being exacerbated by environmentalist pressure on the number and timing of flights.
Because neither Minneapolis nor Amsterdam is a major O&D point, traffic growth depends on connecting traffic and increasingly on traffic connecting at both hubs. So, unlike the prospective BA/American alliance, there is little scope for pushing yields up; revenue and, hopefully, profit growth has to come from more services.
The search for a second European hub was a large part of the rationale behind the ill–fated Alcazar project in 1993/94. And now again KLM is in alliance talks, this time with Alitalia, with the aim of developing Milan as the second hub. Improved operating results plus income from the sale of its Northwest stake have left KLM with Dfl2.8bn ($1.4bn) in cash as at the end of the first half of 1997/98.
The Malpensa 2000 project would seem to offer possibilities. Inevitably, it is running behind schedule, but work on the airport and surrounding infrastructure should be finished by 1999, enabling the transfer of all services, long–haul and intra–European — with the important exception of the Milan–Rome shuttle — from Linate to Malpensa. Alitalia management has a project team in place, including US schedulers, working on the construction of a European hub from scratch, so something startlingly innovative could emerge.
Situated at the opposite corner of Europe’s golden rectangle from Amsterdam, a revitalised Malpensa could be used as a hub for KLM’s traffic to the Middle East and the Indian sub–continent; it could collect feed from these regions and North Africa; it could be used as an alternate routing for US–Eastern European flows; and, as KLM and Alitalia are the only point–to–point operators between Amsterdam and Milan cities, there is already the basis for a shuttle service.
The big problem is that Northwest does not have authority to serve Italy and the US–Italy bilateral precludes a KLM code–shared operation from the US.
This aeropolitical barrier is convenient, as Air France — which is regarded in Rome as more compatible in political terms — can then be promoted as a commercial alternative to KLM. Air France and Alitalia code–share on France–Italy routes and both have agreements with Continental, though only Alitalia code–shares (on Milan–Newark) at present.
This could create a new multi–hub system: Houston/Newark/Paris CDG/Milan, but to make it work Alitalia would have to be willing to shift many long–haul services from Rome. It also raises new antitrust questions: could immunity be extended to two major European airlines code–sharing with one US carrier across the North Atlantic?
The third permutation involves Delta and Swissair. If Malpensa succeeds, one of the biggest losers would be Zurich, which currently siphons off a large proportion of Lombardyoriginating traffic. Bringing Alitalia into the Atlantic Excellence Alliance would be an essentially defensive move, adding one more hub to the European network and attempting to control competition between Zurich and Milan.
However, Delta may be considering the prospect of linking up with a major European carrier — Air France — rather than continuing with two smaller carriers. In which case Delta, which also has an agreement with Air France and flies to Milan, could emerge as a direct competitor to Continental for the US role in a new tripartite alliance. The fact that it has just lost Singapore Airlines from the now defunct Global Excellence Alliance to Star yet again underlines the fluid nature of alliances.