China Re-emerges,
Western Airlines Retreat
Jul/Aug 2024

By mid-year the Chinese aviation markets had finally reopened, their recovery lagging the rest of the world. While domestic passenger traffic was about 10% above 2019, international passengers on Chinese airlines were still were about 30% below. Meanwhile, Western airlines have been reducing or eliminating their Chinese services, which have proved to be unsustainably loss-making.
There is a sharp contrast between the current performance and official long-term optimism about China. Boeing’s 2024 market outlook projects Chinese traffic growth at 6.2% pa up to 2043 compared to 4.4% for the rest of the world, giving a global average growth of 4.7% pa. This means that Boeing (and Airbus) are relying on Chinese markets to generate about 25% of the incremental traffic growth over the next 20 years.
Conversely, economic performance indicators are stronger in the short-term and weaker in the long-term. In July the IMF revised up its 2024 GDP estimate for China from 4.6% to 5.0%, but it envisages a long-term decline in the growth rate, due to declining productivity gains and, importantly, the impact of a rapidly ageing population, largely the result of the “One Child” policy; a 3.3% growth rate is forecast for 2029.
Political and economic isolation
As of July this year, US sanctions had been applied to over 1,400 Chinese entities including giant semiconductor producers like SMIC and YMTC, ICT conglomerates like Huawei and Tikvision, and aviation manufacturers like Changhe Aircraft Industries and Jiangxi Hongdu Aircraft. The sanctions have impacted aviation both through the collapse in Chinese trade and tourism and through direct restrictions on direct airline capacity between the two countries.
US-China seat capacity at the beginning of this year was at about 10% of the prepandemic level. However, the US government has since agreed to increase the number of direct flights between the US and China from 35 to 50 per week, compared to 325 prepandemic. United, Delta and American argued against this modest increase and continue to lobby through A4A. Their message was encapsulated in a letter to the Secretary of State and the Transportation Secretary: “If the growth of the Chinese aviation market is allowed to continue unchecked and without concern for equality of access in the market, flights will continue to be relinquished to Chinese carriers at the expense of US workers and businesses.”
At present it seems unlikely that the sanctions policy will be eased under either a Harris or a Trump administration, indeed they may well be escalated if there is an incident between the PRC and the ROC (Taiwan). In the unlikely event that sanctions are eased, the difficult question for the US airline industry is whether “equality of access” is a genuine market requirement or protectionism as a response to the fundamental problem of competitiveness.
Australian airlines abandon China
Another indication of the depth of the problems Western carriers were having in the China market came in June this year when Qantas closed its Sydney-Shanghai route, in effect pulling out completely from the PRC. This route had been resumed in 2023 and was meant to go daily in March 2024. The reasons given were weak demand, strained diplomatic relations and the decision by the regulator, AACC, to terminate Qantas’s codeshare agreement with China Eastern.
Qantas has never been able to realise the apparent potential of the emergent Chinese market. Its Sydney-Beijing service was being downsized before the pandemic and was closed in 2020. Attempts by the lower-cost subsidiary Jetstar to establish regular services also failed.
There are now no Australian carriers flying to China while the Big 3 Chinese carriers, as well as other Chinese airlines, offer over 100 flights per week to Australia during July-September, which is the low season.
The market is predominantly Chinese-origin and price-sensitive — tourists, students and VFR — and so has been dominated by the Chinese airlines. Qantas’s strategy relied on winning high-yielding business travellers, but it appears that the market simply was not there.
European airlines and the Russia Airspace problem
For European carriers, closure of Russia’s airspace following the invasion of Ukraine has been blamed for the withdrawal of Chinese services. The airspace above Russia was closed to Western airlines in 2022, forcing airlines to take a longer, more southerly route. On London-Beijing this increased the flying time by 2hrs 45 min or about 25% for BA, while Chinese airlines continued to fly the shorter trans-Siberia route.
European airline representatives claim that they are at a 30% cost disadvantage compared to the Chinese, but the route diversion would only account for about a third of this gap.
BA has announced the closure of its London-Beijing service from October, following on from Virgin Atlantic’s cessation of London-Shanghai. Air China and China Southern and China Eastern have responded by increasing capacity to the extent that the overall London-China market has grown by about 40%, comparing this summer to 2019.
Overall, Chinese carriers are estimated to have pushed up European capacity by 16% compared to 2019. Total capacity is up at all the European hubs with the exception of Paris where total Paris-China capacity is down about 30% compared to 2019, the result of the liberal bilateral between the two countries being suspended, which has partially locked Chinese carriers out of what was their favoured European gateway. Air France is insisting on a “balanced” return to prepandemic frequencies, and there have also been calls for some form of tax to close the cost difference between Air France and the Big 3 Chinese carriers.
The European Commission has signalled its intention to investigate possible anti-competitive actions on the part of the Chinese, specifically whether they are using the routeing advantage to dump capacity, which they cannot use to the US, into the European market, depressing fares and establishing a dominant market position. However, there appears to be a regulatory issue in that aero-relations are governed not by an EU-China bilateral but by a series of bilaterals between individual European countries and China. The Commission could attempt to coordinate a unified response from the member states.
Culture and cost
European carriers have tended to regard connections to routes to Beijing and other major Chinese cities as prestige routes. In 2023 BA stated that the Beijing route was “one of its most important” when it relaunched flights after the pandemic. The idea is that the European network airlines had to be positioned to take advantage of the potential as the Chinese economy surged, possibly returning to the same global importance as it enjoyed in the sixteenth century when it was estimated to account for between a quarter and a third of the global economy. But now they may have to accept the same commercial logic as the Australians.
The Europe-China market is based on outbound Chinese tourism, with limited business demand, especially following the deterioration in diplomatic and trade relations, so it is very price-sensitive and quite seasonal, not the type of market where high-cost European network carriers can compete effectively. Moreover, long-haul international travel is a new experience for the large majority of Chinese so there are high cultural barriers to selling in this market. Familiarity is a strong marketing tool.
Earlier this year DragonTrail, a special market research firm, surveyed a sample of 1,015 experienced Chinese travellers. Some of the findings were:
-
Asia, unsurprisingly, is the main holiday destination, chosen by 60% of respondents, but 27% replied that they intended to visit Europe in contrast to just 3% for North America.
-
When asked which travel type was preferred, there was an almost equal split between group and independent travel (though “independent” wasn’t precisely defined).
-
“Value for money” or “products with the best price” dominated answers to questions on choosing travel products.
-
When booking outbound travel 60% of the responses referred to domestic booking platforms like Ctrip and Qunar; 38% via travel agencies on Chinese social media like WeChat and Xiaohongsu; 27% directly through airlines; 23% through traditional travel agencies; 37% others; and 17% international booking platforms like booking.com (multiple responses so the total sums to more than 100%).
Overall, there was a huge preference for local airlines. As the Chinese travel market matures, travellers may become more receptive to choosing foreign airlines in the same way as the Americans, Europeans and, to a lesser extent, the Japanese have done. But the Chinese carriers have an entrenched position not just because of cultural barriers but also because of their relatively low costs.
The Global South potential
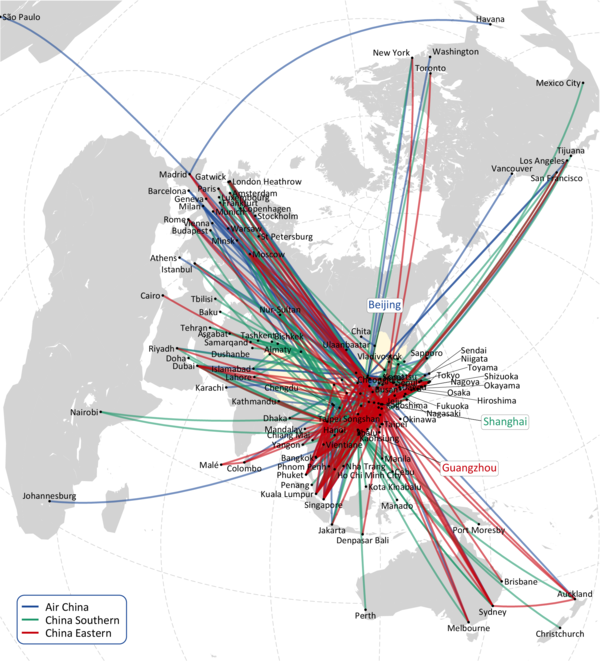
The map which shows the combined international network of the Big 3 (as at August 2024) indicates the concentration of capacity in Southeast Asia and the importance of Europe compared to the US, as well as revealing the limitations of their operations. There are few operations into Africa, India and South America.
Sanctions have accelerated the key trend in China’s economic development. Economic growth had been driven by rapid expansion in domestic manufacturing and surging local consumer demand, but investment in foreign countries is increasingly important. And that investment — for example, in electric car manufacturing, lithium battery production, mining, smartphones and consumer goods — is concentrated in the Global South, which is Africa, South America and the developing Asian countries.
According to The Economist, foreign revenues from the Global South for stockmarket-listed Chinese companies quadrupled between 2016 and 2023 to nearly $800bn, while revenues from the developed world by increased by 90% to $780bn.
The top five countries for greenfield foreign direct investment by Chinese companies in 2023 were Saudi Arabia, Malaysia, Vietnam, Egypt and Morocco. The Global South is also emerging as the major consumer sector for Chinese products.
So the airlines that will benefit most from Chinese economic power are those that connect Chinese airline networks into the Global South.
The super-connectors, especially Emirates which has fully restored capacity to China, are very well positioned. They are also the most likely to capture Chinese travellers to Europe who are looking for an alternative to Chinese carriers.
The new Saudia sees China as its most important market.
Ethiopian Airlines’ new hub airport at Addis Adaba offers pan-African connections, and has Chinese signage throughout.
There would appear to major potential for Indigo to develop Chinese links, politics allowing.
In Central and South America, connecting networks have not yet been developed, though Copa has an agreement alliance with Air China to connect traffic at Panama (Air China has yet to reinstate its Panama route first introduced in 2018).
Chinese Big 3 Recent Results
When we last reviewed the Chinese Big 3 (see Aviation Strategy, Dec 2022) the PRC was in the process of abandoning its zero-Covid policy, and it looked as if Air China, China Southern and China Eastern could make a swift return to their historic growth.
After three disastrous years during the pandemic — combined losses at the operating level of $24bn (a negative -25% margin on revenues) and $29bn at the net — 2023 allowed for some recovery in traffic.
The number of domestic passengers carried by the Big 3 jumped by 150% year-on-year to 353m — some 7% higher than in the whole of 2019. (The three airlines in 2023 accounted for 60% of the total domestic passenger numbers, up from 56% in 2019.) Regional passenger numbers (on flights to Hong Kong, Macau and Taiwan) increased over nine-fold to 7.2m, but were still less than two-thirds of the prepademic traffic on those routes. International passenger numbers at 22m were 14 times the prior year levels, but still only 40% of the numbers achieved in 2019.
Total combined revenues in that year of $59bn were only 1.5% short of the turnover in 2019; and Air China and China Southern reported a small operating profit — at a margin of 2% and 3.4% respectively. The full year net losses for the three of $1.9bn (in large part due to weaker performance at China Eastern) was a vast improvement on the near $17bn net loss reported for 2022.
| Air China | China Southern | China Eastern | |||||||
|---|---|---|---|---|---|---|---|---|---|
| Jan-Jun | 2024 | 2023 | Δ | 2024 | 2023 | Δ | 2024 | 2023 | Δ |
| Financial results (RMBbn) | |||||||||
| Revenue | 82.8 | 63.7 | ↑30% | 84.8 | 71.8 | ↑18% | 67.4 | 52.1 | ↑29% |
| Operating result | (1.1) | (0.9) | ↓20% | 4.5 | 1.4 | ↑215% | 0.0 | (2.6) | ↑102% |
| Net result | (3.5) | (4.0) | ↑12% | (0.4) | (2.5) | ↑84% | (3.1) | (6.6) | ↑53% |
| Pax (m) | |||||||||
| Domestic | 65.2 | 52.6 | ↑24% | 70.4 | 61.6 | ↑14% | 58.1 | 49.4 | ↑18% |
| Regional | 2.3 | 1.2 | ↑83% | 1.0 | 0.6 | ↑50% | 1.8 | 0.9 | ↑90% |
| International | 7.5 | 1.7 | ↑333% | 8.0 | 2.8 | ↑189% | 7.8 | 1.6 | ↑390% |
| Total | 75.0 | 55.5 | ↑35% | 79.4 | 65.0 | ↑22% | 67.7 | 51.9 | ↑30% |
| Load Factor | 79.3% | 70.5% | ↑9% | 83.1% | 75.8% | ↑7% | 81.2% | 71.8% | ↑9% |
| Passenger yields∗ | 0.54 | 0.61 | ↓12% | 0.49 | 0.56 | ↓13% | 0.53 | 0.60 | ↓13% |
| Unit revenues† | 0.43 | 0.43 | ↓1% | 0.41 | 0.42 | ↓3% | 0.44 | 0.45 | ↓2% |
| Avg fare | 1,104 | 1,147 | ↓4% | 1,067 | 1,105 | ↓3% | 995 | 1,004 | ↓1% |
In the first half of 2024, the traffic recovery has continued apace (see table): Domestic passenger numbers up by another 18% year-on-year, regional by 78%, and international up by 283%. Regional traffic in the period had recovered to 80% of pre-pandemic levels, international to 86%. And all this growth came with a useful recovery in load factors of around 8.5 percentage points to over 80%.
Although revenues were 25% higher than the year before, financial results continue to disappoint. China Southern managed to produce a 5% operating margin, and China Eastern eliminated the losses it reported in the same period of 2023. But Air China’s operating loss worsened to RMB1.1bn ($-156m). All three published net losses for the six month period.
None of the three pay much attention to shareholder communication — maybe it’s a cultural thing, but given their ownership structure, maybe they don’t think they need to. (For the complexities of the ownership structure of aviation in China see Aviation Strategy, Jul/Aug 2019).
In the official results release, or even in a brief accompanying presentation, it might be a nice idea to explain how and why the airline group produced the results it did.
China Southern gets the prize for its first half Management Discussion and Analysis that includes the comment “We deeply carried out flight punctuality improvement actions... and reduced the number of passengers affected by unpunctual flights by 1.717 million year-on-year”.
China Eastern in its results release at least stated “affected by the factors such as intensified competition in the domestic passenger transportation market, the lack of recovery of capacity in some international markets, competition from high-speed rail, and high oil price fluctuations, the operating pressure on airlines remained huge”.
Air China was a bit more informative: “there was no significant reduction in the number of operating entities in the market, hence the Company still faced relatively huge industry competition pressure... as the international market has not yet fully recovered, widebody aircraft were used in the domestic market, which intensified the imbalance between supply and demand. In respect of the international market, the newly resumed and increased routes of domestic airlines were mainly concentrated in destinations such as Europe, Central Asia and the Middle East, resulting in an intense competition in certain regions.”
So: too exuberant a reintroduction of capacity, yields fall (by 12%), load factors are up but unit revenues decline.
If only we understood Mandarin.
| Air China | China Southern | China Eastern | ||||||||||
|---|---|---|---|---|---|---|---|---|---|---|---|---|
| In service† | Δ v 2019 | On order | In service | Δ v 2019 | On order | In service | Δ v 2019 | On order | ||||
| A320 | 348 | (42) | +58 | 50 | 362 | (11) | +45 | 96 | 373 | (1) | +45 | 99 |
| A330 | 55 | (1) | -10 | 28 | (1) | -19 | 56 | (1) | -- | |||
| A350 | 30 | +20 | 20 | +14 | 20 | +13 | 6 | |||||
| A380 | -- | -5 | -- | |||||||||
| 737 | 396 | (1) | -9 | 55∗ | 380 | (5) | -21 | 32 | 276 | -26 | ||
| 747 | 13 | (2) | +3 | -2 | 0 | -- | ||||||
| 757 | 0 | -5 | -- | -- | ||||||||
| 777 | 39 | (3) | +11 | 2 | 32 | (1) | +5 | 34 | +14 | |||
| 787 | 14 | (1) | -- | 12∗ | 40 | +3 | 10 | -- | ||||
| ARJ21 | 27 | (2) | +27 | 11∗ | 32 | (1) | +32 | 23 | +23 | |||
| C919 | -- | 100 | -- | 105 | 6 | +6 | 100 | |||||
| ERJ | -- | 0 | -20 | 2 | +2 | |||||||
| Total | 922 | (52) | +95 | 230 | 894 | (19) | +32 | 233 | 800 | (2) | +75 | 205 |
