Importance of Accurate
Modelling of Emissions
Jul/Aug 2022


Reducing fuel burn and carbon emissions is clearly one of the important challenges for the aviation industry, perhaps the most important. But calculating and measuring emissions, on a detailed flight, type, and airline basis, is a remarkably difficult exercise. In this article Skailark explains its innovative approach to modelling emissions.
Accurate and timely tracking of fuel efficiency is critical for helping airlines lower their direct operating costs through reducing fuel consumption and cutting carbon emission costs. Regulators need a reliable information source in applying environmental legislation. And for passengers the stated carbon footprints of competing services play an increasing role in choosing a flight.
Given the importance of measuring carbon emissions, users should be aware of the shortcomings of existing models whose oversimplified approaches can result in significantly wrong estimates. A common fault is the use of generic assumptions, for example using an average take-off weight (TOW) for aircraft types. In reality the TOW is determined by different seat configurations, actual passenger load factor, belly cargo, and specific aircraft capabilities (for example fuel tanks and structural enhancements). Higher TOW obviously increases fuel consumption, and therefore emissions, by as much as 20% over standard TOW aircraft. Similarly, the latest generation aircraft are about 20% more fuel efficient compared to older generation models, so neglecting the specific aircraft model can lead to quite erroneous outputs.
Then we need to be clear about which emissions we are talking about. Pure CO2 emissions from the combustion inside the engine are chemically defined to be approximately 3.16kg CO2/kg of jet-A (1) fuel burned — this is the tank-to-wing measurement. But if we include emissions from fuel processing (refinery, transport, storage), as well as those from the combustion process, the result will be significantly higher —this is the well-to-tank measurement.
There are also the non-CO2 emissions produced by aircraft — SO2, H2O, PM, NOx, HC, CO, smoke, heavy metals, etc. — the effects of which on radiative forcing are currently the subject of research. If normalised to the equivalent global warming potential of CO2, these emissions could potentially triple the engine-based CO2 emissions up to around 9kg CO2e (equivalents) for every kg of jet-A (1) fuel burned.
Google has been grappling with the issue of non-CO2 emissions. Apparently because it decided that the scientific research on these emissions was not complete, it recently decided to exclude them from its calculations of emissions per flight, which resulted in a remarkable decline of up to 40% in flight pollution ratings, which in turn made flying look better in comparison to railways. Note that Google was not dismissing the importance of non-CO2 emissions, it just had decided to wait until further research had been carried out which allowed greater accuracy of measurement. Interestingly, the sudden change in Google’s emissions measurements provoked questioning on the part of the general press, consumer groups and environmental bodies as to the accuracy and consistency of current CO2 assessment methodologies.
The model
The Skailark model has been designed to address these questions. One of its fundamental characteristics is that it is transparent, detailing the calculations every step of the process. Users can change key assumptions in the model, and are invited to contribute in order to improve and fine-tune the model over time.
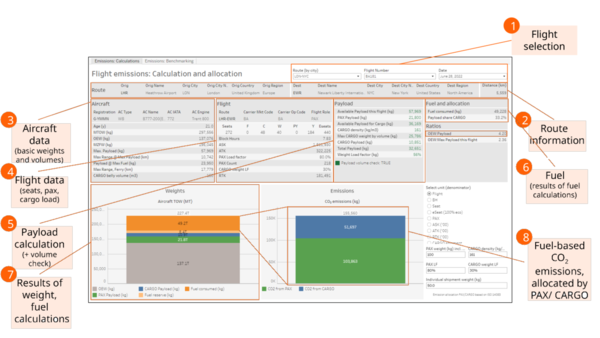
Looking at the Emissions Calculation Tool the core data sources are:
- Tail-level data (engine types, MTOW, seat configuration) for every commercial aircraft in the world.
- Satellite-based data for every flight (route) in the world tracking actually flown distance and flight time.
The Skailark model calculates the TOW for a specific aircraft on a specific route, going through the following steps:
- Operating empty weight (OEW) which includes the aircraft structural weight, non-fuel fluids, crew, and all operator items and equipment required for flight except payload and fuel.
- Payload PAX = Seats * Load factor (based on airline performance, by class if required) * Average weight per passenger (adjustable).
- Payload CARGO = Max Payload for this flight (based on the aircraft’s payload-range performance) — Payload PAX, equivalent to the: Maximum Available Payload for Cargo, then adjust for cargo density (weight/volume trade-offs) and cargo load factors (adjustable).
- Reserve fuel weight.
- Actual fuel weight based on the estimated payload characteristics (this is an iterative process: the payload affects the fuel weight and the fuel weight itself also adds weight, requiring additional fuel).
This bottom-up modelling calculates the total TOW, establishing the fuel consumed on this flight, and hence derives direct combustion-based CO2 emissions. In parallel Skailark also employs a top-down statistical model, based on historically reported consumption, to validate the results.
The output is tank-to-wing combustion-based emissions, but non-CO2 emissions or well-to-tank emissions can be estimated by applying standard multipliers.
The summary graphs shown in Chart 1 break out the TOW of the aircraft on the specific flight by OEW (Operating Empty Weight), Pax Payload, Cargo Payload, Reserve Fuel and Fuel Consumed, and also allocate the consumption between passenger and belly freight.
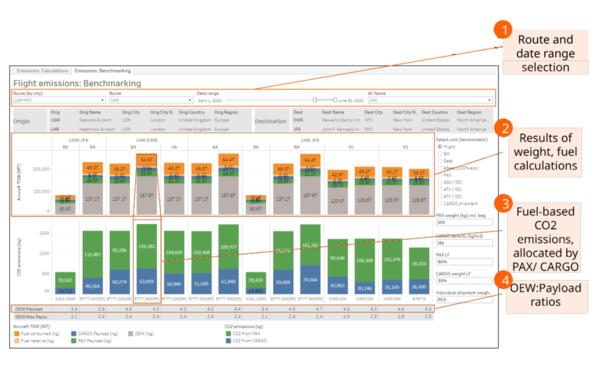
Chart 2 provides a sample output from Skailark’s Benchmarking Tool which aggregates flight-based information at various levels — route, date range, carrier, aircraft type, etc. Key input assumptions can be dynamically adjusted — PAX and CARGO weight, load factors, CARGO density. Emissions can be normalised to flight, block hour, seat, eseat, PAX, ASK, ATK, RTK, even for specific cargo shipments.
Optimising emissions
Chart 2 introduces a new KPI — OEW:Payload, in other words, how much “empty aircraft weight” is required to carry the payload on a specific route. Applying the OEW:Payload across aircraft on a single route clearly indicates significant differences. For example, flying short- or medium-haul aircraft close to their “max. range at max. payload” capabilities is very efficient compared to flying wide-body aircraft on those routes. Indicated by lower consumption and emissions per payload.
This can also be observed in the chart. The B6-operated (JetBlue) flights on the route from London to New York with a narrow-body A321LR indicate an OEW:Payload of 3.4: about 14.9 tonnes of payload are carried by 50.6 tonnes of OEW. In contrast, BA’s 777-200ER from LHR to EWR has an OEW:Payload ratio of 4.5: about 30.6t of payload are carried by 137.1t OEW. This additional weight to be carried contributes to the increase in fuel consumption per passenger from around 360kg to 490kg.
Aircraft that have capability to fly 15,000km instead of 8,000 are much heavier, even when empty (longer range requires more fuel tanks, a more solid surrounding structure and landing gear). Historically, the argument was that heavier aircraft flown on shorter routes could carry a higher payload (eg, more belly freight); however, modern high-powered aircraft are usually not weight-limited on routes much below their max. range. It is the (belly) volume that is the limiting factor (industry-average cargo weight load factors are rarely higher than ~50%).
Ultra long haul vs connecting flights
The basic problem with ultra long-haul flights is that the last gallon or litre of fuel that is needed to land the aircraft 15,000km away from the departure point has also to be carried for 15,000km — this additional fuel weight results in a higher aircraft TOW, which again requires additional fuel, which again increases the TOW.
Therefore, after a certain distance the fuel consumption per payload starts to rise exponentially. This cannot be a good idea for either airline operating costs or the climate.
The graph looks at CO2 emissions per passenger on widebody routes plotted against distance flown (the area of the circles reflect the number of seats flown on each route). The optimum point appears on routes at around 7,600km (eg London to Vancouver, Dubai to Osaka, or Atlanta to Santiago de Chile) which generate c550kg of CO2 per pax, equivalent to 7.2g CO2/RPK. At stage lengths of 13,500km routes such as Dubai to Los Angeles and Singapore to San Francisco generate nearly 1.4 tonnes CO2/pax (c9.75g CO2/RPK). The longest route, Singapore to New York produces 2 tonnes CO2/pax (c13.1g CO2/RPK).
Sustainable Aviation Fuel (SAF) has been suggested as a solution to this problem. Qantas has used it as a reason to justify the sustainability of its “Project Sunrise” which aims to provide non-stop services on such as the 17,000km route between Sydney and London. But SAF is simply not available in sufficient quantities at present, nor will be for the foreseeable future.
So ultra-long flights are actually worse in terms of fuel consumption per payload than connecting flights. For many passengers this seems counter-intuitive as the trip involves taking two flights instead of one, but in reality the two flights could cut the carbon footprint per passenger by as much as 40% compared to sitting in a seat for over 16 hours.