US stock-market
Jul/Aug 2001

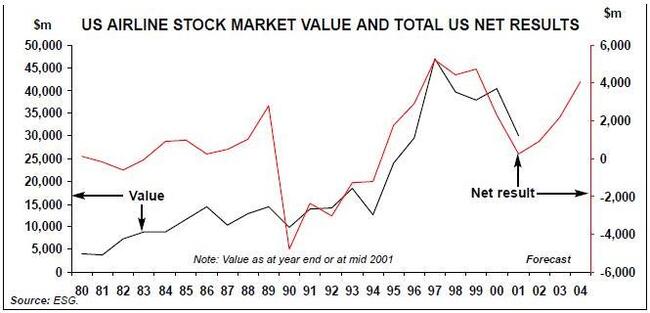
This chart, compiled from ESG data, tracks the performance of the US airline stock–market values against profitability. It would suggest that the stock–market is not yet reflecting the precipitous decline in profits expected this year.
However, it is interesting to note that airlines have actually outperformed the S&P in 15 of the last 28 years, as well as being a markedly cyclical stock. In peak airline markets these stocks have beaten the market by more than ten percentage points.