US financial results: pretty robust
August 2000

Second quarter results from the US airlines generally portray a picture of robust financial health, with exceptions as usual.
Overall the top six plus Southwest reported a 13% growth in revenues to $24bn. In the period capacity overall was restrained to a growth of 3% while traffic grew by 8% and the load factor improved by nearly 4 points to 76.6%. At the top end of the range, Southwest generated a 20% growth in revenues on the back of a 14% increase in capacity while at the bottom of the range US Airways achieved only a 6% increase in revenues despite a near 10% jump in capacity.
Both American and United registered decreases in seat capacity as they rolled out the new aircraft configurations giving passengers more space — and in United’s case the introduction of the Economy–plus cabin. The top carriers managed to persuade passengers to pay for some of the increase in fuel costs with a 3.5% increase in passenger yields in the period giving a near 5% improvement in RASM (revenues per ASM).
American and United achieved the highest rate of growth in RASM at 12.5% and 13.5% respectively — showing that their low capacity strategy works — while US Airways suffered a decline of 4%. ( US Airways had suffered a strike at the end of the first quarter, which had a carry–over effect into the second quarter as passengers refrained from booking in fear of a continuation).
The adoption of SAB 101, regulating the reporting of the sale of FFP miles to third parties as a part of Passenger revenues rather than the catch–all "other", has distorted the prior year comparisons to a modest degree, but is only a cosmetic change.
On the cost side, the main story for the period remains the high cost of fuel. Jet kerosene spot prices continued their upward trend in the quarter and despite hedging activities represented a severe extra burden to the top seven of some $990m, with an fuel price per gallon some 50% higher on average.
With the exception of the position at United, the cost bases excluding fuel remain reasonably well contained. At United however, non–fuel unit costs jumped by 11%, mainly as a result of wage snap–backs as the ESOP plan put in place at the time of the employee buyout comes to an end.
The various hedging activities of the major carriers to smooth the impact of fuel price movements have had a significant impact — with American and Delta reporting savings for the quarter of over $100m each. While the US economy remains strong, it should be reasonable to expect that the industry will be able to recoup the higher fuel cost from passengers over time.
Meanwhile, the process of attacking distribution costs continues apace. This is one of the principal benefits to the industry of the "new" economy. Internet and on–line sales are growing at a significant pace — although still remaining a relatively small part of the total. The start up of the industry–wide portal Orbitz to counter the other on–line agents should help to accelerate the trend.
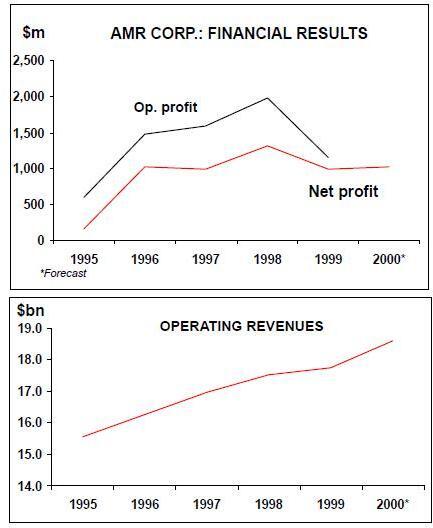
For the major carriers as a group, gross operating cashflow (EBITDAR) grew 12% to $5.1bn. It is interesting to note that both American and United achieved a modest increase in EBITDAR margins showing again the successes of their low growth strategy. Net profits increased overall by 12% to $1.7bn, with American, Delta and Southwest all achieving growth above 20% a year.
Following the spate of recent share buy backs and capital manipulation, the earnings per share for the quarter continued to show very strong improvements for all except USAirways. On a simple average EPS grew by 15% — but by 29% if US Airways is excluded.
| Revenues | % chg | EBITDAR % chg | Margin | Net | % chg | EPS | % chg | ||
| AMR | 5,011 | 10.4% | 962 | 14.0% | 19.2% | 321 | 19.8% | 1.96 | 44.1% |
| Delta | 4,469 | 14.0% | 1,179 | 10.8% | 26.4% | 460 | 26.4% | 3.51 | 46.3% |
| Continental | 2,571 | 17.9% | 587 | 12.0% | 22.8% | 149 | 12.9% | 2.46 | 42.2% |
| Northwest | 2,927 | 12.7% | 479 | 2.4% | 16.4% | 115 | -4.2% | 1.26 | -2.3% |
| USAir | 2,433 | 6.4% | 385 | -16.5% | 15.8% | 80 | -48.0% | 1.17 | -72.5% |
| UAL | 5,109 | 12.5% | 1,075 | 24.3% | 21.0% | 408 | 16.9% | 3.47 | 21.3% |
| Southwest | 1,461 | 19.7% | 432 | 18.8% | 29.6% | 191 | 20.8% | 0.36 | 24.1% |
| Total | 23,981 | 12.7% | 5,099 | 11.1% | 21.3% | 1,724 | 11.6% | ||
| RPM | ASM | Pax | Pt | Yield | % | RASM | % | Unit cost | % | |
| % chng | % chng | LF | chng | (cents) | chng | (cents) | chng | (cents) | chng | |
| AMR | 5.3% | -0.8% | 75.9% | 4.4 | 13.75 | 6.0% | 10.44 | 12.5% | 10.24 | 10.0% |
| Delta | 7.1% | 3.1% | 77.8% | 2.9 | 12.83 | -0.3% | 11.00 | 13.3% | 9.38 | 4.9% |
| Continental | 10.5% | 6.1% | 77.1% | 3.1 | 13.38 | 5.4% | 10.32 | 9.9% | 9.85 | 10.3% |
| Northwest | 8.5% | 3.7% | 79.7% | 3.5 | 11.92 | 4.2% | 9.50 | 8.9% | 9.24 | 9.1% |
| USAir | 11.5% | 9.7% | 74.7% | 1.2 | 16.24 | -5.6% | 12.14 | -4.0% | 12.62 | 2.0% |
| UAL | 6.8% | -0.9% | 75.6% | 0.5 | 13.62 | 7.3% | 11.57 | 13.5% | 10.09 | 14.4% |
| Southwest | 15.7% | 13.9% | 74.3% | 0.1 | 12.93 | 4.0% | 9.91 | 5.1% | 7.77 | 4.2% |
| Total | 8.2% | 3.0% | 76.6% | 3.6 | 13.40 | 3.5% | 10.76 | 4.9% | 9.89 | 5.5% |