Market balance: reasons to be cheerful
August 1999


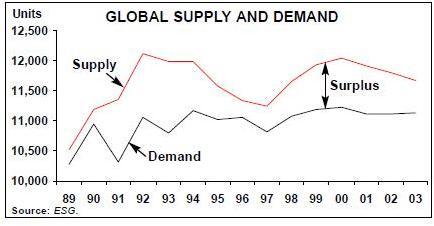
The good news is that a global surplus in aircraft akin to that of the early 1990s is no longer likely. The latest ESG forecast, issued in July (which Aviation Strategy follows regularly), now predicts that the surplus this year will be the equivalent of 757 jet units, or under 6% of supply, and that it will hover around this level for a couple of years before declining around 2003.
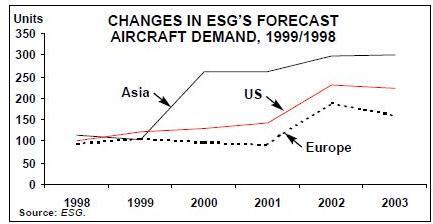
This new forecast sharply reverses a clearly identifiable trend in ESG forecasts over the past three years (see, for example, Aviation Strategy, March 1999) which had seen the predicted global surplus grow seemingly inexorably. Now, the estimated surpluses for 1999 and 2000 have been reduced by about 18% since the equivalent forecast in July 1998.
The first reason for the change is a more optimistic outlook for traffic — in particular Asia has recovered much more quickly and robustly than anticipated, so that there is a net increase rather than net decrease in aircraft demand from Asian airlines. Recent reports tend to support this judgement: for example, the latest AAPA statistics for April show that international RPKs are up 7.9% on an annual basis (and April 1998 was not one of the really depressed traffic months). However, there is a huge variation in the Asian airlines’ performance — China Airlines grew at 21% while PAL’s traffic was down 40%.
The second reason, which applies over the longer term, relates to a changing view on the size composition of the world fleet. Over the years ESG has been reducing noticeably the average size of aircraft in the world fleet. The latest forecast shows a further downward revision, although ESG has not gone as far as Boeing in this regard. (This means, depending on utilisation and load factor assumptions, that more jets will be needed to carry the same number of passengers.)
Regional Jets are coming more and more into the picture, but more importantly, airlines are clearly signalling their preference for 777s and A330/340s. As the table below shows, there is no space for a new large capacity aircraft like the A3XX in the ESG world view, so presumably this forecaster is not very popular with Airbus.
Remarkably, ESG has slightly reduced its retirement forecast, mainly because of the technical reason that scrapping in 1998 exceeded the expected total for last year. Here, ESG is being conservative, keeping the forecast number of scrapped units at 250–350 a year for the next four years, reflecting only a moderate impact from the implementation of Chapter 3 noise rules.
So what we are seeing is, hopefully, a gentle glide into the down phase of the aviation cycle rather than a crash landing. While the supply/demand balance is undoubtedly softening, the deterioration has not been as bad as expected. On the North Atlantic, for instance, great worries were expressed about the influx of capacity from Asia; indeed the AEA has reported an ASK increase of 14% for the first five months of this year, but traffic has grown by 13% in the same period.
Reasons to be puzzled
However, there are still a number of key questions regarding the precise nature of this phase of the cycle.
First, although traffic is rebounding in Asia, airlines in that region are having to make the painful change from operating in a relatively high–yield environment to a generally low–yield one. This means continued cost cutting, productivity improvements and rationalisation through mergers and joint venture — in other words an accelerated version of the transition that European flag–carrier were forced into in the early and mid- 1990s. Otherwise, even the relatively modest increase in the Asian fleet predicted for the early years of the next century will not materialise.
Second, one wonders whether some of the US carriers have pushed their non growth strategies too far. Assuming that all the planned Stage 2 conversions take place, as they have to, by the end of this year, the Majors will only have enough additional capacity available to accommodate a 1–2% increase in domestic traffic without pushing load factors up to more uncomfortable levels. And it is now very clear that US passengers are resisting what are regarded as exorbitant business–class and full–economy fares.
Third, the strategy of preferring 777 and A330/340 types over traditional jumbos is becoming conventional wisdom among the main intercontinental airlines, which is always dangerous. Airlines are in effect pushing up their per seat costs in anticipation of higher per seat yields resulting from a higher proportion of business- class passengers on their intercontinental flights.
In choosing this strategy, airlines are moving away somewhat from the predictable demand growth associated with the leisure industry to the uncertainties of partly competing with the communications business. Faster, easier communications via the Internet and tele–conferencing will undoubtedly generate more business opportunities and business travel, but it will also cut marginal business trips — and no one can be certain of the net impact of these two trends.
| 1994 | 1995 | 1996 | 1997 | 1998 | 1999F | 2000F | 2001F | 2002F | 2003F | 2004F | |
|---|---|---|---|---|---|---|---|---|---|---|---|
| Airbus A300 | 23 | 17 | 14 | 6 | 13 | 8 | 8 | 4 | 4 | 4 | 4 |
| Airbus A310 | 2 | 2 | 2 | 2 | 1 | 2 | 2 | 2 | - | - | - |
| Airbus A318 | - | - | - | - | - | - | - | - | 20 | 40 | 45 |
| Airbus A319/320/321 | 64 | 55 | 72 | 127 | 168 | 205 | 242 | 195 | 170 | 155 | 150 |
| Airbus A330 | 9 | 30 | 10 | 14 | 23 | 39 | 46 | 45 | 30 | 35 | 35 |
| Airbus A340 | 25 | 19 | 28 | 33 | 24 | 25 | 20 | 20 | 25 | 30 | 35 |
| Boeing 717 | - | - | - | - | - | 12 | 30 | 20 | 20 | 20 | 30 |
| Boeing 737-300/400/500 | 121 | 89 | 76 | 132 | 116 | 44 | 2 | - | - | - | - |
| Boeing 737-600/700/800/900 | - | - | - | 3 | 165 | 276 | 280 | 215 | 185 | 160 | 175 |
| Boeing 747-400 | 40 | 25 | 26 | 39 | 53 | 48 | 12 | 12 | 18 | 25 | 30 |
| Boeing 757 | 69 | 43 | 42 | 46 | 50 | 66 | 48 | 35 | 25 | 25 | 25 |
| Boeing 767 | 40 | 36 | 42 | 41 | 47 | 41 | 45 | 40 | 35 | 35 | 40 |
| Boeing 777 | - | 13 | 32 | 59 | 74 | 85 | 64 | 60 | 60 | 60 | 60 |
| Boeing MD-11 | 17 | 18 | 15 | 12 | 12 | 8 | 6 | - | - | - | - |
| Boeing MD-80/90 | 23 | 32 | 36 | 42 | 42 | 40 | 3 | - | - | - | - |
| AVRO/BAe 146 | 28 | 22 | 26 | 22 | 20 | 25 | 15 | 10 | 10 | 10 | 10 |
| Fokker 70/100 | 34 | 41 | 17 | 7 | - | - | - | - | - | - | - |
| CRJ-50/70 | 26 | 40 | 53 | 59 | 77 | 70 | 70 | 65 | 50 | 40 | 30 |
| EMB-145 | - | - | 2 | 33 | 60 | 80 | 80 | 70 | 50 | 40 | 30 |
| Do-328 | - | - | - | - | - | 16 | 27 | 27 | 28 | 21 | 21 |
| TOTAL UNITS | 521 | 482 | 493 | 677 | 945 | 1,090 | 1,000 | 820 | 730 | 700 | 720 |