Market outlook: a mass of conflicting images
August 1998

The aviation industry presents a mass of conflicting images at present — economic disaster in Asia, boom in America and Europe; record profits for airlines, distress for Boeing; new aircraft in storage but orders still pouring in; an imminent widebody surplus but unfulfilled demand for narrowbodies. Here Aviation Strategy unravels the trends.
The economic background
Perhaps surprisingly, there is a positive side to the Asian crisis. The OECD Economic Outlook, published in June, argues that the immediate effect of the weakening in exports to Asia has been to reduce the danger of over–heating in the US and European economies. Hence strong economic growth may be sustainable for longer than previously expected.
Economic activity in the OECD region is projected to expand at about 2.5% p.a. in 1998 and 1999, which is only slightly below the level forecast last year. In addition, the economies of Germany and France, which had been lagging behind those of the US and the UK, are now showing strong signs of a significant cyclical upturn.
The big uncertainty, however, is Japan, where sluggish economic fundamentals plus a very fragile financial system have been aggravated by the Asian crisis. Japan remains mired in recession, with a real GDP decline expected this year, but the recently announced package of fiscal and de–regulatory packages could, if effectively implemented stabilise the situation and allow a return to moderate growth next year.
How much has the aviation market balance changed?
Unfortunately, it seems that the global aviation industry, despite the optimistic outlook for Western economies, is likely to take a sizeable hit from the Asian crisis. That is the implication of the latest forecast from ESG, published in July*.
As ESG represents the industry–standard in supply/demand forecasts, it is useful to appreciate the basic methodology. To summarise: the actual or projected number of RPMs is converted into aircraft by factoring in the average global load factor to get to ASMs, which are then divided by optimal average utilisation, speed per hour and average seating in order to give an estimated demand (cargo jets are also added in). This demand figure can then be subtracted from the actual or projected supply of aircraft in the worldwide commercial aviation fleet, the fleet projections taking account of future deliveries and retirements. The difference between demand and supply is the surplus that can manifest itself in jets parked in the desert or in underutilised and/or under–occupied aircraft flying around.
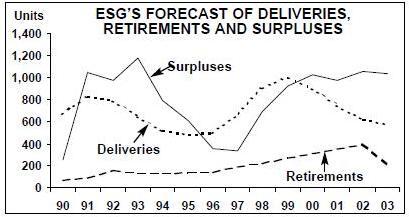
This graph below illustrates the significant rise in the surplus as projected now and that forecast a year ago when there seemed to be little to worry about in Asia. According to the new analysis the surplus can be expected to rise to around 7% next year and to stay there until 2002 when ESG assumes that there will be a market cyclical downturn in the West.
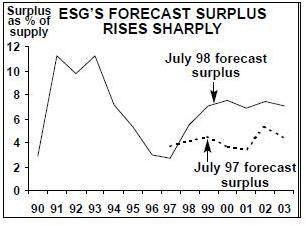
This surplus is just shy of the 8% mark that ESG regards as being very serious — in the early 1990s the surplus was over 11% — but in absolute terms the number of surplus aircraft, over 1,000, is very close to that of the last, dire recession.
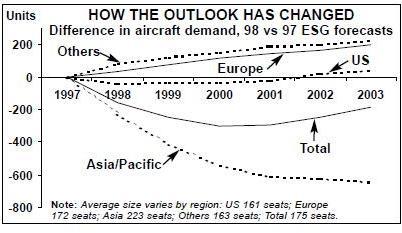
The graph below summarises where the changes in forecast aircraft demand occur. As expected most of the decline takes place in Asia while the US is down slightly and Europe up noticeably. Curiously though, demand from the rest of the world also rises significantly compared to last year. There is no obvious reason for this.
No aircraft forecast is complete without a reflection on aircraft retiral rates — or more specifically as to why actual scrapping rates are so much lower than anticipated (both ESG and Boeing have been 100% out on their deletion numbers in the last five years).
For the surplus to stay at around 7% and not drift up to 10–11%, some 1,000 aircraft will have to be retired between now and the end of 2000. This number, which is incorporated in the ESG forecast, is roughly twice the rate experienced during 1992–97. It appears not unreasonable given that non–operation rules for Chapter 2 jets will be in force from 2000 in Europe and 2003 in North America, but this legislation primarily impacts narrowbodies while the surplus this time seems to be emerging in the widebody sector.
What’s happening to the Asian surplus?
There is more than enough evidence now to match ESG’s theoretical slump in Asian aircraft demand to actual developments in the region. Examples include the following.
- Most dramatically, PAL is officially shrinking its fleet from 55 to 14 jets (though the realistic rationalised total is more likely to be 25) and is negotiating with Boeing to cancel the four 747–400s it is due to take delivery of, and with Airbus on the return of the eight A340s it is operating.
- Thai has managed to take all 16 planned 1998 deliveries, but on operating lease rather than outright purchase, and has sold eight aircraft so far with a further nine sales planned.
- Garuda is negotiating with Boeing and Airbus for the cancellation of leases on six MD–11s and six A330s.
- MAS has deferred nine deliveries of 747-400s and 777s, due in 1999 to 2003; 11 737s and one A330 have been leased out or returned early to the lessors, plus a further 10 747s and DC–10s are to be sold.
- Cathay intends to take delivery of 13 firm orders this year and next, but is attempting to sell or lease out five 747–200s; the other two -200s are likely to go as well while its six -300s could also be phased out.
- Qantas has postponed planned A340/777 purchases for at least two years, is selling four A300s and is buying three second–hand 747–400s.
- Korean is negotiating to defer as many as possible of a total of 11 747s, 777s and A330s due for delivery next year.
- Even SIA has announced a quite extensive deferral programme — eight 747–400/777/ A340s due to be delivered this year and next will not now be taken until 2000–2001.
There have also been important capacity re–deployments. For example, SIA has increased capacity on non–Asia routes by 9-16%, including fifth freedoms to New York over Frankfurt and Amsterdam, while cutting Indonesian services in particular. Qantas has suspended all South Korean flights and cut back on Japan while adding services to the US and using 747s domestically. MAS has also suspended some Asian services and introduced a three–times a week flight to New York over Dubai.
So not only is the Asian surplus being transferred to other markets through aircraft sales but also the Asia/Pacific carriers are, wherever possible, deploying their own capacity from intra–Asia to the Pacific and the Atlantic.
And at Seattle the number of aircraft in storage is moving slowly but inexorably upwards because Asian airlines have been unable to accept deliveries: 19 aircraft, including five 747s, were being stored by Boeing at the end of the second quarter, compared with eight a year ago.
Why are orders still coming through?
Orders are not just still coming through, airlines are ordering at a (slightly) higher rate than last year. As the tables on pages 5–6 show, there were 638 firm orders in the first half of this year compared with 1,246 for the whole of 1997.
Some of the biggest orders have come from European flag–carriers — Air France, Iberia, Sabena — which had previously been prevented by the terms of their state aid injections from placing orders, but there have also been substantial investments from the leading US majors — Delta, United, Continental and American. Three of these airlines have long–term agreements to order Boeing equipment, which are intended to insulate fleet planning from the vagaries of the order/delivery/traffic cycles, and these orders (plus upcoming orders like American’s for DC–10 replacements) are elements of the long–term contracts. South America, where market conditions are very buoyant, accounted for a large proportion of Airbus’s orders.
However, one cannot but wonder about some of the orders. Is this really the correct time in the cycle for small start–ups like AB Airlines to be committing to new jets for the first time? How can technically bankrupt Korean justify an order for 22 new generation 737s (unless it has reached an accord with Boeing on the 11 747s and 777s it has on order)?
So far there have been no cancellations or deferrals from non–Asian carriers, with one small exception which may be significant. British Airways has switched three 747–400 orders to 777s and cancelled outright a further -400. Chris Avery, aviation analyst at Paribas (whose production forecast appears on page 21), reads a great deal into this, recalling that BA was the first major airline to appreciate that the industry was falling into recession in the early 1990s and the first to negotiate with Boeing on changing production slots.
Yet at the same time British Airways is on the point of placing a 30–100 order for either 737s or A320s. It is ruthlessly playing the two manufacturers off against each other by demanding “financial flexibility” in their proposals. What this means is that BA is expecting to take the aircraft on favourable lease terms which will probably include “power by the hour” provisions, in effect, forcing the winning manufacturer into taking on part of the risk of operating the aircraft from the airline.
BA’s strategy again illustrates the disparity that is emerging between the potentially oversupplied widebody market and the relatively balanced 150–seater market.
What are the manufacturers doing?
Airbus has dismissed the Asian crisis as a minor blip; Boeing, much more exposed to the Asian market, argues that the crisis is at least self–contained and will result in only a production loss of 150 units over five years. Both are gearing up production rates in the short term.
Airbus has shifted A320 family production up from 18 to 22 a month to avoid a complete log–jam of slots. Boeing, trying to overcome the huge setback it received when it was forced to install over–wing emergency exits on the new generation 737s in to order to receive certification, is attempting to push up production from 14 to 21 a month, a process which the Boeing chairman, Phil Condit, describes as entailing “significant performance risks”. Boeing has also increased the production of the 747 to five units a month from four and the 777 to seven from five, a move which, again according to Condit, means “performance and schedule risks”. “Schedule” in this case presumably means airlines not being able to take delivery of completed models.
The problem for Boeing is that it has so far failed to make anything like a reasonable return during the upswing and peak of the ordering cycle; its share price fell 14% in one day following the announcement that second quarter 1998 net profit was $258m, 45% down on the same period in 1997. Its strategy of extreme outsourcing, taking over MDC and matching Airbus on price and terms has backfired badly.
Now it has little choice but to keep pumping out planes while making some probably futile gestures on (irrelevant) sticker prices and price escalation clauses. However, it does recognise the fundamental uncertainties of the widebody sector, and has stated that it is planning to cut back 747 production in 1999.
What are the implications of a widebody recession?
A global airline recession isn’t inevitable — the surplus identified by ESG might be mitigated by a slowdown in manufacturers’ output, scrapping might accelerate and the underlying economic strength in the West might provide a secondary boost to traffic. But if there is going to be a recession, it will primarily be a widebody recession.
In the last recession oversupply was concentrated in the narrowbody sector, which resulted in a collapse in second–hand values, which in turn allowed start–ups into the market, so intensifying competition and further damaging the incumbents. In a widebody recession the dynamics will be somewhat different, as there is not the same scope for new entrants onto long–haul routes because of the remaining bilateral barriers and because of the much higher capital cost of large jets. Major carriers might even be able to benefit from lower rental charges.
On the other hand, the transatlantic market is the main source of profits for the likes of BA, Lufthansa and KLM, and a substantial increase in capacity — at the same time as slots are being given and open skies are being universally implemented — is a serious concern. US carriers are picking up bargain 777s with the intention of expanding on the Atlantic. And Virgin Atlantic has bought five 747–200s from Air New Zealand at about $26m each (Boeing’s sticker price for a -400 is $166–185m) and has leased, with purchase options, another two -200s from Cathay.
| % growth p.a. | 1997 | 1998 | 1999 |
| US | 3.8 | 2.7 | 2.1 |
| Japan | 0.9 | -0.3 | 1.3 |
| Germany | 1.2 | 2.1 | 2.7 |
| France | 2.4 | 2.9 | 2.8 |
| UK | 3.3 | 1.7 | 1.8 |
| OECD | 3.1 | 2.4 | 2.5 |
| Airbus | Boeing | Others | ||||||
| European airlines | May 27 | 6 737-700s | ||||||
| AB Airlines | ||||||||
| Adria Airways | Feb 24 | 1 | CRJ-200LR | |||||
| Aer Lingus | Feb 4 | 1 A330 | ||||||
| Air Berlin | Mar 3 | 2 737-800s | ||||||
| Air France | Jun 23 | 15 A319s, 3 A321s | May 20 | 2 737-800s | ||||
| Air Littoral | Feb 24 | 5 | CRJ-100s | |||||
| Air Nostrum | Mar 10 | 5 | CRJ-200ERs | |||||
| Bavaria | May 4 | 5 717-200s | ||||||
| Brit Air | May 20 | 2 737-700s | Feb 12 | 1 | CRJ-100 | |||
| Condor | May 31 | 1 757-300 | May 8 | 6 | CRJ-100s, 2 CRJ-700s | |||
| CSA | Mar 1 | 2 737-400s, 1 737-500 | ||||||
| Edelweiss Air | Mar 31 | 3 A320s | ||||||
| European Regional AL | Jan 27 | 2 | ERJ-145s | |||||
| Iberia | Jun 19 | 31 A320s, 19 A321s | ||||||
| KLM | Apr 7 | 4 737-800s | ||||||
| Lauda-air | Mar 1 | 1 767-300ER | ||||||
| Lufthansa | Apr 20 | 10 A340s | ||||||
| Jun 24 | 1 A340 | Jun 30 | 3 MD11-Fs | |||||
| Lufthansa CityLine | Mar 20 | 3 | CRJ-100s | |||||
| Maersk Air | Mar 2 | 2 | CRJ-200LRs | |||||
| Nouvelair | Apr 24 | 1 A320 | Jun 1 | 1 | CRJ-200LR | |||
| Park Express | Mar 23 | 5 | RJ100s | |||||
| Ryanair | Mar 9 | 25 737-800s | ||||||
| Sabena | Mar 12 | 26 A319s, 5 A320s | ||||||
| 3 A321s, 2 A330-200s | ||||||||
| Swissair | Mar 12 | 9 A340-600s | ||||||
| Turk Hava Yollari | Apr 23 | 2 A340-300s | ||||||
| Tyrolean AW | Feb 9 | 2 | CRJ-200B LRs | |||||
| Tyrolean JS | Feb 4 | 2 | 328JETS | |||||
| Undisclosed | Feb 7 | 1 747-400 | ||||||
| European total | 223 | |||||||
| Airbus | Boeing | Others | ||||||
| North American airlines | Apr 7 | 2 A340-500s, | ||||||
| Air Canada | ||||||||
| Air Wisconsin | 3 A340-600s | Jun 23 | 4 CRJ-200LRs | |||||
| Alaska AL | May 19 | 1 737-400, 5 737-700s | ||||||
| American AL | May 15 | 25 737-800s | ||||||
| Atlantic Coast AL | Apr 3 | 8 777-200s | Mar 5 | 5 CRJ-200ERs | ||||
| Business Express | Feb 26 | 20 ERJ-135s | ||||||
| Continental | Mar 18 | 15 737-900s | ||||||
| Delta AL | Mar 27 | 2 777-200s | ||||||
| May 19 | 4 757-200s, 1 737-800 | |||||||
| 1 767-300ER | ||||||||
| Federal Express | Apr 22 | 3 MD11-Fs | ||||||
| Midway AL | Apr 8 | 3 CRJ-200ERs | ||||||
| Southwest AL | Jan 22 | 59 737-700s | ||||||
| TWA | Apr 21 | 24 MD 80-83s | ||||||
| United | Feb 27 | 20 A320s, 10 A319s | Apr 14 | 16 777-200s, 1 747-400 | ||||
| 6 767-300ERs | ||||||||
| USAF | Jan 30 | 1 747-400F | ||||||
| US Navy | Jun 10 | 1 737-700 | ||||||
| North American total | 240 | |||||||
| Asian airlines | Mar 30 | 6 A330-200s | ||||||
| Air Lanka | ||||||||
| CASC | Jun 29 | 5 737-700s, 5 737-800s | ||||||
| China Airlines | Feb 25 | 4 737-800s, | ||||||
| 4 747-400s | ||||||||
| EVA Air | May 28 | 1 747-400 | ||||||
| Korean Air | Jun 9 | 11 737-800s, 11 737-900s | ||||||
| Singapore Aircraft LE | Feb 10 | 2 A320s | ||||||
| Asian total | 49 | |||||||
| Others | Jun 2 | 1 737-300 | ||||||
| Boullioun Aviation Services | ||||||||
| Egyptair | Jan 26 | 2 A340-600Rs | Jun 30 | 1 737-300 | ||||
| El Al | Apr 1 | 3 737-800s, | 2 737-700s, | |||||
| 1 747-400 | ||||||||
| GECAS | Mar 3 3 A321s, 6 A320s, | Jan 9 | 2 737-300s | |||||
| 1 A319 | Jun 30 | 1 737-300 | ||||||
| LanChile | Mar 19 | 11 A319s, 9 A320s | ||||||
| Sunrock Aircraft | Jun 5 | 1 737-500 | ||||||
| TACA Group | Mar 19 | 21A319s, 11 A320s | ||||||
| TAM | Mar 19 | 25 A319s, 13 A320s | ||||||
| Undisclosed | Feb 4 | 4 A320s | ||||||
| Apr 27 | 2 A330s | |||||||
| Apr 29 | 1 A320, 2 A321s | |||||||
| May 6 | 2 A319s | Mar ? | 1 MD11 | |||||
| Others total | 126 | |||||||
| OVERALL TOTAL | 287 | 282 | 69 | 638 | ||||