The Pacific's terrific, but is it all that it's cracked up to be?
April 2018

According to Irving Berlin the Atlantic’s not romantic and the Pacific not terrific. In aviation terms he may have been wrong about the latter.
In the following charts and tables we present an analysis of the Pacific market.
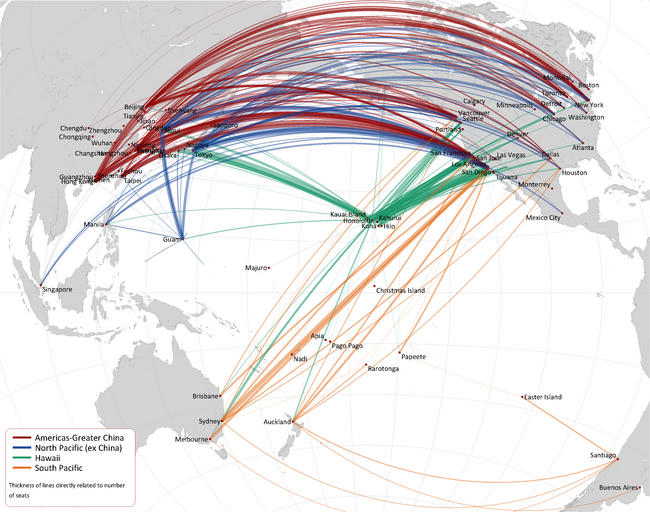
The Pacific is a huge area — the ocean accounting for 45% of the planet’s water — ringed by extreme volatility in geological and political terms. It encompasses huge distances: the average stage length for flights between Asia and the Americas is over 10,000km. It includes some of the longest routes in the world: SIA plans to reintroduce a direct flight between Singapore and New York towards the end of the year using its new A350-900ULR aircraft — an amazing 19 hour flight and 15,300km — which will top the current world record of 17 hours between Auckland and Doha.
Total traffic on the Pacific measured in RPK terms is around half that on the Atlantic — the largest and most mature long haul market. Because of the distances involved this inflates its importance: the total number of seats and passengers is around a quarter of that carried on the Atlantic. In itself long haul is a small part of the market, accounting for around 15% of the total numbers of passengers and seats. As a result the Pacific has tended to be a relatively modest part of the global industry — at least until recently. What has changed is that Chinese traffic, and Chinese airlines, have been pushing growth on to the region at an amazing rate.
The Pacific route structure can be divided into four broad areas, each displaying different characteristics: Americas to Asia ex China; Americas to Greater China (including Hong Kong and Taiwan); Hawaii — the ultimate tourist paradise; and the South Pacific.
Hawaii
For the purpose of this analysis we have cheated a bit and included all the data for the domestic US services to its Pacific haven: they account for over 80% of total seat capacity to the island group. Hawaiian has very successfully defended its niche position and has 25% of the market (up from 19% in 2010), closely followed by United, Delta, American and Alaska/Virgin America — see chart.
One of the perhaps surprising results of the analysis is that the largest city pair by far on the Pacific in terms of the number of seats is Honolulu to Tokyo (having grown by an annual average 3.5% since 2010 and overtaken Honolulu to Los Angeles in 2017).
This incidentally is the second largest international city-pair route out of the USA behind London-New York, albeit with 2.6m annual seats less than half the size of the latter. Indeed it is a favoured destination from North Asia: JAL, ANA, Korean and Asiana enjoy a near 10% share of the total Hawaiian market, which has grown by an average annual 4% since 2010.
ANA meanwhile recently announced that it plans to configure its three A380s on order — all destined for the Honolulu route, with the first delivery scheduled for 2019 — with 520 seats in four classes, more than twice the capacity of the 787s it currently operates on the route (according to the schedules the highest current density for the A380 is 517 seats operated by Qatar).
North Pacific
We have defined this route area as from North and Central America to North and South East Asia excluding greater China (including Hong Kong and Taiwan). Total growth in this segment has been lacklustre, with average annual increases in capacity since 2010 of 3%.
The market has consolidated to a certain extent: American and JAL, and United and ANA established metal-neutral anti-trust immunised joint ventures in 2011; Delta and Korean are due to cement a similar agreement in 2018 — see chart.
Following this the three will have an effective 70% of the market — slightly below the share of the Atlantic enjoyed by the three main joint ventures in that market but important nevertheless.
Within the segment it is noticeable that some of the prime traditional routes to Japan have been static or in decline (see table), Korean routes have grown modestly, while Philippines Airlines and Air Canada have grown substantially faster than the market at an average 15% and 10% respectively.
South Pacific
The South Pacific is the smallest cousin in this group of route networks. It encompasses routes between North America and the Australasia and there to South America and involves around 6m seats a year — it has grown at an average compound rate of 4%. It is not surprising that it is relatively small: the population of Australia and New Zealand is around 29m. The largest route in the segment is Los Angeles to Sydney; and the population of the greater Los Angeles metropolitan area is estimated at 14m.
Capacity on the route area has grown at an annual average 4% in the past seven years. 60% of the capacity is covered by Qantas, Air New Zealand and Delta/Virgin Australia — who gained approval for an immunised joint venture in 2011, renewed for ten years in 2016. Qantas and American have been trying to do the same, and after rejection in 2016 reapplied for approval from the DoT in February 2018. If successful the Qantas JV will almost regain the 35% share of the business it had in 2010.
Americas-Greater China
This is the terrific element of the Pacific. Within this area we have included routes to Taiwan and Hong Kong — more traditionally treated as North Pacific or SE Asian destinations — which catches the declining element of Hong Kong as a gateway to China and the relatively strong growth exhibited by Taipei.
Here the growth has been extraordinary. Capacity on the routes have doubled since 2010, a compound average annual growth of 11%, and the market has fragmented. Back then Cathay, United/Continental, EVA, China Airlines and Air Canada held 75% of the seat capacity on the segment. Since then the mainland Chinese carriers have emphasised a push into the market. In 2017, Air China, China Eastern, China Southern and Hainan (including their subsidiaries) accounted for 33% of the capacity up from 15% seven years ago.
In 2010, there were only three main entry points into China Pacific (Hong Kong, Beijing and Shanghai) serving routes to 10 main points in the Americas (San Francisco, Vancouver, Los Angeles, Chicago, Toronto, New York, Detroit, Seattle and Washington) — although there was also a four times a week service by China Southern from its hub in Guangzhou to Los Angeles.
Since then, the capacity on the established routes has grown at a phenomenal rate: up by a compound annual average of 14% out of Beijing and Shanghai (and 40%pa out of Guangzhou); 14% out of New York, 10% Los Angeles, 9% Vancouver and Toronto, 20% Seattle.
Moreover, the number of points served has proliferated. By 2017 there were services from another 14 points in China (albeit operating only one or two flights a week) — Changsha, Chengdu, Chongqing, Fuzhou, Hangzhou, Jinan, Nanjing, Qingdao, Shenyang, Shenzhen, Wuhan, Xi’an, Xiamen and Zhengzhou. These are all megalopolises representing a combined population of 225m people. There were an additional seven points in the Americas (Dallas, Boston, Houston, Montréal, San Jose, Las Vegas and Calgary) representing a combined metropolitan population of 28m, although two of those destinations are major hubs.
This exciting development of air services is likely to continue. A large part of this growth is still likely to come from the expansion of the Chinese carriers as they develop services from airports behind China’s congested hubs. It is hardly surprising that the North American players have been trying to establish relationships with their Chinese counterparts: Delta with its 3.6% equity stake in China Eastern; American with a 2.7% stake in China Southern; Air Canada announced it is in talks to form a “joint venture” with Air China on the Canadian market.
With the current incumbent in the White House and increasingly protectionist rhetoric, a full open skies agreement seems a long way off.
| Rank | City Pair | Seats (‘000s) | CAGR | ||
|---|---|---|---|---|---|
| 1 | (1) | Los Angeles | Taipei | 1,220 | +0.7% |
| 2 | (6) | San Francisco | Taipei | 1,092 | +8.5% |
| 3 | (2) | Hong Kong | San Francisco | 1,020 | +0.1% |
| 4 | (3) | Hong Kong | New York | 997 | +3.9% |
| 5 | (18) | Los Angeles | Shanghai | 983 | +22.6% |
| 6 | (5) | Hong Kong | Los Angeles | 954 | +5.8% |
| 7 | (4) | Hong Kong | Vancouver | 931 | +3.8% |
| 8 | (8) | Beijing | New York | 757 | +8.0% |
| 9 | (20) | Beijing | Los Angeles | 642 | +18.2% |
| 10 | (17) | San Francisco | Shanghai | 636 | +14.8% |
| 11 | (10) | New York | Shanghai | 627 | +7.2% |
| 12 | (12) | Beijing | Vancouver | 613 | +8.0% |
| 13 | (7) | Hong Kong | Toronto | 605 | +0.5% |
| 14 | (14) | Taipei | Vancouver | 577 | +9.4% |
| 15 | (30) | New York | Taipei | 572 | +36.2% |
| 16 | (9) | Beijing | San Francisco | 551 | +3.9% |
| 17 | (19) | Beijing | Toronto | 503 | +12.7% |
| 18 | (11) | Chicago | Shanghai | 493 | +4.0% |
| 19 | (22) | Shanghai | Toronto | 491 | +16.3% |
| 20 | (15) | Shanghai | Vancouver | 474 | +6.5% |
| Rank | City Pair | Seats (‘000s) | CAGR | ||
|---|---|---|---|---|---|
| 1 | (1) | Los Angeles | Tokyo | 1,585 | -0.16% |
| 2 | (2) | Los Angeles | Seoul | 1,543 | 4.58% |
| 3 | (6) | New York | Seoul | 916 | 3.28% |
| 4 | (5) | Chicago | Tokyo | 899 | 0.82% |
| 5 | (3) | New York | Tokyo | 860 | -3.45% |
| 6 | (7) | San Francisco | Seoul | 845 | 2.83% |
| 7 | (4) | San Francisco | Tokyo | 825 | -2.28% |
| 8 | (13) | Dallas | Tokyo | 538 | 6.00% |
| 9 | (8) | Tokyo | Vancouver | 527 | 2.01% |
| 10 | (15) | Seattle | Seoul | 515 | 7.68% |
| 11 | (27) | Los Angeles | Manila | 476 | 15.97% |
| 12 | (14) | Seoul | Vancouver | 436 | 4.95% |
| 13 | (20) | Tokyo | Toronto | 395 | 7.51% |
| 14 | (24) | Houston | Tokyo | 388 | 9.41% |
| 15 | (9) | Tokyo | Washington | 379 | -1.61% |
| 16 | (11) | San Francisco | Singapore | 369 | -0.82% |
| 17 | (25) | Manila | Vancouver | 364 | +9.5% |
| 18 | (23) | Seoul | Toronto | 360 | 7.32% |
| 19 | (12) | Chicago | Seoul | 359 | -0.45% |
| 20 | (18) | Atlanta | Seoul | 337 | 2.81% |
Note: analysis of scheduled seats 2017