Alaska Air absorbs Virgin America's
"great emotional energy"
April 2017

Alaska Air Group’s $4bn acquisition of Virgin America, which closed in mid-December, has been generally well-received by US analysts and investors. The combination has moved quickly to take advantage of new growth opportunities. The merger synergy target has been raised from $225m to $300m. Everyone agrees that the new Alaska will continue to report industry-leading 20%-plus pretax margins.
The merger combined two award-winning, low fare airlines into “West Coast’s premier carrier” and the fifth largest US airline, which will benefit from the West Coast’s strong economy and a focus on the growing “bleisure” segment.
The management team, led by CEO Brad Tilden, has an impressive track record. Alaska has been an industry leader on many financial fronts, be it cost reduction, profit margins, debt reduction, managing to ROIC or returning capital to shareholders.
In a recent report, JP Morgan analysts reiterated their “higher-than-usual confidence in Alaska’s ability to profitably integrate”. Two-thirds of the analysts who cover Alaska currently have a positive recommendation on the stock.
However, this merger also faces many potential challenges that have prompted some analysts to adopt a wait-and-see approach (and neutral ratings).
In addition to the usual integration risks associated with airline mergers (especially with systems and labour), the Alaska-Virgin America deal faces fleet dis-synergies, sizeable labour cost hikes, potential loss of premium market share, and risks associated with expansion in some of the nation’s most competitive markets.
One of the toughest decisions was what to do with the two strong brands. Alaska announced on March 22 that it would eliminate the Virgin America name, probably in 2019. Will Virgin America’s cult-like followers take their business to other airlines?
Another potential problem is that the combination is going down-market with the product offering. Will that result in a loss of premium market share on the transcon?
Investors are eagerly awaiting Alaska’s big decision on whether or not to retain two fleet types in the longer term — expected by year-end 2017. What is the management’s current thinking?
Another question in the minds of investors: Will Alaska be successful in re-deleveraging its balance sheet after borrowing $2bn to finance the acquisition?
Alaska held its first post-merger investor day on March 29, which gave the management an opportunity to tackle some of those issues and explain the strategy and plans in more detail. Highlights included a presentation on a thorough 10-month brand analysis.
Bigger platform for growth
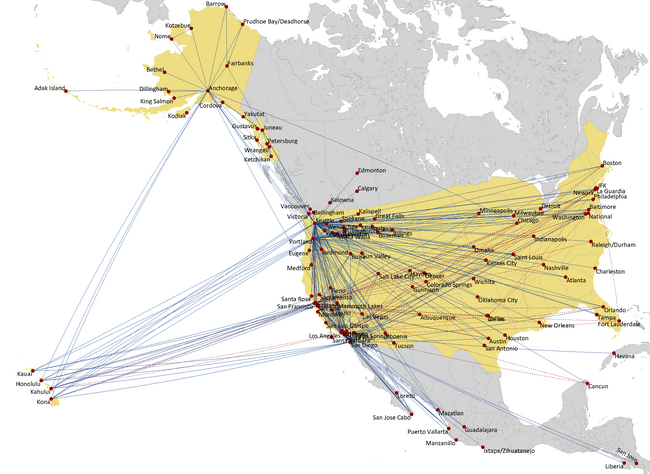
Alaska has grown at a relatively brisk 7.7% average annual rate since the mid-1990s. 2015 and 2016 both saw a 10.6% capacity growth. As a result, the network has broadened from the original north-south/West Coast/Alaska niche to include sizeable transcon, midcon and Hawaii operations; and destinations in Mexico, Canada, Costa Rica and Cuba (since January). But the network is still heavily focused on the states of Washington, Oregon and Alaska.
A couple of years ago, in the face of the consolidation of the US airline industry, Alaska’s management became convinced that “scale is relevant” and that Alaska Air, too, should be bigger.
The Virgin America acquisition represented a unique opportunity to get a solid foothold in California, which has more than three times the population of Alaska, Washington and Oregon combined (39.1m, compared to 11.9m). California is also the nation’s largest economy.
The deal gave Alaska an “enhanced platform for growth” so that it could become more relevant to customers on the West Coast and nationally. The deal also brought more access to slot-constrained airports on the East Coast.
Alaska paid a big premium for what it considered “scarce real estate” and a one-time opportunity. But it would have taken it a long time to achieve the same through organic growth because of airport infrastructure constraints alone. There was also a defensive element to the deal: JetBlue was also bidding for Virgin America (see Aviation Strategy, April 2016).
At the investor day, Alaska’s management found a novel way of communicating the West Coast’s economic dynamism: the “crane index”, or the number of cranes that are currently up in each city. That number was roughly 2.5 times higher on the West Coast than on the East Coast, even though the latter has a much larger population.
Alaska has moved quickly to take advantage of the new growth platform, launching reciprocal FFP accruals and codesharing just five days after the merger closed.
As of mid-April, in the four months since the merger closed, Alaska had announced an unprecedented 37 new routes from the West Coast that “connect the dots”. The services will be operated on a codeshare basis until the airlines are able to combine their operations.
The routes announced so far include at least 13 new destinations from San Francisco, seven from San Diego, five from the LA Basin, three from San Jose, and two from Portland. Alaska has also announced a 40% increase in Dallas Love Field flying — an aggressive move that targets business traffic at Southwest’s home base.
Such routes were not viable (or a priority) for Virgin America, but they now look attractive, first, because of the critical mass achieved when the networks are combined. Second, much of the new growth is to cities Alaska already serves, which helps reduce start-up and operating costs.
Another reason why some routes are now more viable is that there is more fleet flexibility. Virgin America lacked a regional aircraft type to take advantage of mid-sized markets. Now, for example, Alaska is bringing its regional partner SkyWest’s E175s to Dallas Love Field this summer to replace Virgin’s A320s on the La Guardia and Washington National routes. The A320s will be freed up for new transcontinental services.
Importantly, California presents a sizeable opportunity for Alaska to grow its loyalty and credit card programmes, which currently bring in $900m in cash flow annually.
Alaska operates an unusually generous FFP by industry standards. It also continues to make the programme more attractive, which contrasts with the trend of other US airlines reducing the basic value proposition to regular FFP members as they focus more on revenue at the top.
That helps explain why Alaska’s FFP has attracted 3m members in the Pacific Northwest, or one in every four residents. But the airline also attributes the high participation to its 69% customer “relevance” in the region (meaning that 69% of the residents are able to take nonstop flights on Alaska Air to where they want to go in North America).
In California, Alaska currently has 2m loyalty programme members in a population of 39.1m. The strategy is to “build Pacific Northwest-like relevance to develop Pacific Northwest-like loyalty in the significantly larger California market”.
Alaska says that the merger has already increased its customer relevance in California to 38% (120 nonstop markets). Its relevance in San Francisco has increased from 9% (Alaska only) to 70% (Alaska + Virgin, including the Q1 route announcements).
Synergies and dis-synergies
The combination is expected to generate $300m in annual net synergies when fully integrated — $240m revenue benefits and $60m cost synergies. One-time integration costs are estimated at $400m. The synergies are in line with other recent mergers in the US airline industry (see chart).
Because of the focus on debt funding, the transaction is likely to be accretive to earnings in year one (excluding integration costs). The synergies are expected to ramp up quickly, increasing from $26m in 2017 to $300m in 2021.
The integration timetable is robust: a single operating certificate in early 2018, joint labour deals by mid-2018, single passenger service system cutover in late 2018 and the remaining integration in 2019-2020.
Alaska has identified revenue synergies from seven categories: network presence, network growth, fleet deployment, alliance portfolio, aircraft retrofits, cargo and loyalty.
The network synergies will come from two sources: an increase in the number of itinerary/connecting options for passengers created when the existing networks are combined, and from new routes and frequencies facilitated by the larger customer base.
The fleet synergies will come from the availability of two mainline aircraft types (at least for a few years) to better match capacity to demand in different markets. Essentially, Alaska plans to allocate the 178-seat 737-900ERs to the highest-density transcon markets and the smaller (146/149-seat) A320s to north-south flying.
Alaska says that the opportunity to boost revenues from alliances “increases exponentially” with the expanded Los Angeles and San Francisco presence. The two airlines have currently 15 international alliance partners.
The aircraft retrofit synergies will come from a reconfiguration of Virgin America’s Airbus fleet, which entails adding more premium seats, eliminating some economy seats and reducing the premium seat pitch to 41 inches (Alaska’s standard). The net effect is to increase the total number of seats. The move will facilitate Alaska’s generous complimentary upgrades policy for FFP members, increase revenues and lower unit costs. Alaska estimates the revenue benefits at $40m.
Loyalty and credit card programmes are the single largest component of the anticipated revenue synergies. Alaska did not give a figure, but the presentation slides suggested that it could be around 40% of the $240m total.
The $60m cost synergies will come from reduced overheads, improved purchasing power and higher efficiency/asset utilisation.
This merger will see labour cost dis-synergies as Virgin employees are brought to Alaska’s higher pay scales and an A320 rate is incorporated into the Alaska pilot contract. However, pilot costs are on the rise for the industry generally, so not all of the cost escalation at Alaska will be merger-related.
On the positive side, Alaska Air, Virgin America and their ALPA-represented pilot groups have agreed to a timeline and binding arbitration, if necessary, to get to a new joint agreement by early 2018. After that there will be a defined process to agree on seniority list integration by mid-2018. The management expects to get the other labour deals in place in an expeditious fashion.
JP Morgan analysts in their latest report envision a worst-case total labour cost dysergy of $100m for the combined group.
Alaska expects to benefit from the experience of past mergers at other airlines and in other industries. One of the key findings of its research is that if a merger does not work, or if the full synergy value is not extracted, it is typically because the cultures did not work together.
Consequently, and even though the cultures are not that different, Alaska has spent an “extraordinary amount of time” with people from both airlines (using surveys, focus groups, programmes and events) to “define what we want the new culture to look like” and to educate Virgin’s workers about Alaska Air’s history, values, etc.
Alaska is also determined to avoid the problems some past airline mergers experienced with the cutover to a single passenger reservations system. Being able to do a Sabre-to-Sabre migration will help. Otherwise, Alaska is following American’s example of doing it gradually over a number of weeks or months, minimising data migration and using codeshares to bridge to the new Alaska.
The brand decision
The decision to retire the Virgin America name was based on a comprehensive brand analysis that involved hiring an expert brand consulting firm, performing extensive qualitative research (focus groups) in California and Washington, conducting a national survey and completing a financial and operational analysis.
The challenge was that both Alaska and Virgin America have strong but very different brands. Alaska focuses more on the airport experience and has a highly acclaimed FFP, while Virgin focuses on the in-flight experience.
Either brand is a good fit for the “premium-product, low fare” segment (also known as “bleisure” or “leisure enthusiasts”, Alaska’s new term) that Alaska, Virgin America, JetBlue and Hawaiian all focus on. That segment makes up $25bn or a quarter of the $100bn US domestic air travel market.
Alaska’s management had kept an open mind about using two brands because Virgin America has won a cult-like following in the California markets, especially among the Bay area business travellers. Seven out of its top-ten corporate customers are Silicon Valley-based tech companies. The Virgin brand is driving a big revenue premium at Virgin America.
The investor day presentation described Alaska as “service-oriented, authentic and professional” and Virgin America as “feel-good, hip, bold and modern” with “great emotional energy”.
The management mentioned two factors that influenced their decision. First, Alaska appeals to a broader set of customers, while Virgin America has strong peaks at the top end but is less relevant for “value-oriented” travellers (the bottom category that ULCCs typically focus on). Second, preference for Alaska increases at a greater rate when flyers, especially Elite FFP members, become more familiar with the brand.
However, those differences would seem to have little to do with the brand. Virgin America gets fewer “value-oriented” travellers simply because it does not always need to offer the lowest fare types or discount heavily. And the “getting to know” impact is less because the Virgin brand is much better known globally and in the US than the Alaska brand.
The real reason why Alaska is dropping the Virgin America brand is that it believes that the two brands can be combined into a winner. Alaska plans to retain key elements of the Virgin brand such as mood lighting, music and enhanced in-flight entertainment. The management talked of building more “emotional energy” into the Alaska brand.
The new brand will be “warm and welcoming, with a modern, West Coast-inspired vibe”. The planned enhancements, to be rolled out mostly in 2018-2019, include new seats and amenities, new uniforms, satellite WIFI, free movies and chat, more premium class seating and airport lounge expansion. Alaska’s Mileage Plan will become the sole loyalty programme in 2018 and will offer the most generous complimentary upgrades in the industry.
This is obviously the most cost-effective solution. Maintaining two brands would be expensive, inefficient and potentially confusing to passengers.
The new brand could work, but the problem is that the combination is gravitating towards Alaska’s more basic in-flight experience. First, Alaska will offer a lower premium seat pitch than competitors (41 inches in first class, which is a step-down from Virgin’s 55-inches though in line with Alaska’s recent upgrade from 35 inches). Second, Alaska has decided not to offer lie-flat seats, which are now the industry norm on the transcon.
The decision not to offer lie-flat seats reflected Alaska’s determination to keep costs low. Instead, the airline will stick to the strategy that has worked well in the past, which includes easy upgrades to first class and a premium class that “fits the target market we’re going after”.
Many analysts disagree with the strategy of using the first class more as free upgrades for highly valued FFP members, rather than monetising it like the rest of the industry does. But the management insists that the strategy works for the Alaska business model, where “getting a chance to upgrade is part of loyalty, and loyalty is part of successful growth”.
It is not clear if the royalty payment that Virgin America pays to the Virgin Group (0.7% of annual revenues) had any impact on the brand decision. But now that Alaska is eliminating the Virgin America brand, it definitely does not want to continue paying the license fee until the contract expires in 2040.
Virgin Group founder Richard Branson is reportedly very unhappy about the brand decision and said at Virgin Atlantic’s London-Seattle launch event in late March that Alaska would be required to pay royalties until 2040. However, Alaska has a different interpretation of the contract. When asked about it at the investor day, the executives said that there were “lots of ways out of the contract” and that in their opinion they would not need to keep paying for a brand they are not using.
Upcoming fleet decision
Alaska will be a mixed-fleet operator for many years to come because although the vast majority of Virgin’s Airbus aircraft are leased, those leases will not start expiring until 2020. The lease commitments will then dwindle from 60 aircraft in 2020 to just 10 in 2025 (see chart).
The management noted that it would be “extraordinarily expensive” to terminate the Airbus leases early. In any case, Alaska needs the lift and having two mainline types offers useful flexibility when developing the network to become more relevant in California.
The management estimated the current dysergy of operating two fleet types at just $20-25m annually. They speculated that the “added leverage you’d get from having two different manufacturers” might even offset that dysergy (an interesting but not very convincing argument).
Cowen and Company analysts said in a recent research note that they continued to believe that Alaska would move to a 737 fleet and return the A320/A321s as they come off lease. But they also noted that the A321neos could be more interesting as they are attractive aircraft for the Hawaii and transcon markets.
According to regulatory filings, Virgin is due to take 10 A321neos from GECAS in 2017-2018. It also has an order for 30 A320neos from Airbus for 2020-2022 delivery that can be cancelled for just $15m.
Alaska’s management expects to decide by the end of this year whether to remain a mixed-fleet operator or go back to an all-Boeing fleet over time.
Financial considerations
Alaska has been the industry’s financial leader in many respects in the past decade and that is not expected to change post-merger. The only questions are whether the profit margin lead will narrow and whether Alaska will succeed in reducing the debt on its balance sheet.
According to the investor day presentation, last year Alaska had an eight-point lead over the legacy carrier group in terms of pretax margin (22%, compared to 14%) and a three-point lead over the US LCCs (19%). Alaska says that the $300m run-rate merger synergies will make it a 25% pretax margin business.
Most US airlines’ pretax margins are expected to temporarily decline by a couple of percentage points in 2017, but Alaska is still expected to remain in the lead.
The acquisition increased Alaska’s capital base from $4bn to $7.4bn, as a result of which after-tax ROIC declined from 21.3% to around 15% (pro-forma 2016). But that is still almost double the weighted average cost of capital.
Low costs are critical to Alaska’s business model and it has a strong track record on that front: ex-fuel unit costs fell from 9.16¢ in 2009 to 8.24¢ in 2016. The management projects flat unit cost development for 2017 and hopes to continue a slight downward trend over time, though a new pilot contract may temporarily cause CASM to rise.
After slashing its debt-to-capital ratio from 81% in 2008 to 27% in 2015, Alaska saw the ratio soar to 59% in 2016 because it raised $1.8bn of debt to finance the Virgin acquisition (at very attractive rates thanks to its investment grade credit ratings).
A 59% leverage ratio puts Alaska squarely in the middle of the industry, but the management plans to “re-deleverage” and has set a target of 45% by 2020.
Alaska strives for “balanced capital allocation”. Fleet growth and many non-aircraft investments will result in higher near-term capex ($1.2-$1.3bn in both 2017 and 2018), but Alaska is also committed to delivering free cash flow and continuing to increase the dividend. The management indicated that they would do some modest share buybacks this year but otherwise the priority in 2017-2020 is to implement integration, pay dividends and pay down debt.
Competitive concerns
Alaska has coexisted profitably with Delta in Seattle in recent years even as the legacy has aggressively built hub operations in that city. The management sees no reason why Alaska could not deploy the same strategies successfully in San Francisco and Los Angeles.
But investors fear that competition against United in San Francisco might be a different ballgame. United dominates San Francisco with a 47% domestic market share and is less ROIC-oriented than Delta.
JP Morgan analysts suggested that the outcome was actually likely to be “similarly benign” in San Francisco, because Virgin as a pricing agitator is taken out, because the new Alaska represents a significantly lesser threat to United, and because United’s recently-reconstituted board and management offer hope.
But the analysts were less optimistic about Alaska’s prospects on the transcon. Referring to the decisions to eschew lie-flat seats and reduce the first class seat pitch, they said that they were “surprised by the decision to go with an uncompetitive premium product in the lucrative transcon market”. Then again, Virgin has only a 7% share of the premium seats on the New York to San Francisco/Los Angeles routes.
JPMorgan sees JetBlue as the biggest beneficiary of Alaska’s decision to “all-but-abandon the premium transcon market”. The analysts wrote: “If you liked the edginess of Virgin’s offering, JetBlue’s Mint is the next best thing out there”. Since being outbid for Virgin a year ago, JetBlue has expanded the Mint premium product aggressively on the transcontinental routes.
A year ago Richard Branson said that he would consider launching a new Virgin brand airline in the US if Alaska chooses not to use the brand. There could now be an opening for an edgy new entrant to shake things up in the increasingly consolidated US domestic market.
Note: The 2016 figures include Virgin America's results for the 18 days from December 14th to 31st. Sources: Alaska Air Group, J.P.Morgan North American Equity Research (March 30, 2017)
Source: Alaska Air Group presentation (April 2017)
Source: AAG investor day presentation (March 2017)
Notes: † Committed aircraft, including existing firm deliveries. ‡ Fleet if all options exercised and no retirements or lease returns. Source: AAG presentation (March 2017)
Source: AAG presentation (March 2017)
Source: AAG presentation (March 2017)