British Airways: back to the Future Size and Shape.
April 2004

Following the events of September 11 2001, British Airways announced the introduction of a "new" strategy to cope with the changes in the parameters of the business — it was not actually new, but a reiteration and reformulation of the strategic thinking of the previous few years. We have reviewed this strategy several times in the past two years (see Aviation Strategy, January and March, 2002 and April, 2003) in an attempt to see if the company might be on track with its plans. Here is another update.
In March, the company held its annual Investor Day where it outlined current thinking and progress. As usual the outcome is more of the same — BA is on track to deliver the Future Size and Shape (FSAS) envisaged two years ago -- but given the way the industry has failed to recover fully to pre–September 11, 2001 levels, the full delivery is going to take more time than originally expected.
The bedrock of the FSAS strategy is simplicity. All incumbent flag carriers have an inherent complexity of operations that has built up over the past eighty years to the point where it has been all too easy for new entrants to muscle in on what were mono- or duopolistic routes and services. From the basic assumption that the company had to simplify this dynosauric business, follows the current strategic priorities: maintain the best UK–based network and schedule; deliver the "customer promise" consistently; deliver a superior experience for premium customers; develop a high performing organisation; strengthen the company’s reputation; deliver a competitive cost base; strengthen the balance sheet — and finally provide returns for shareholders.
The management was adamant that the FSAS strategy has not just been about costs.
In one sense we may say that — to produce some awful metaphors — it has been an attempt to turn the oil tanker on a sixpence, or to force the evolution of the stegosaurus into the 21st century. The company has had to cut costs to stay alive: but it has tended to cut "back office" costs while investing strongly in the front end product that the customer sees.
The first element of the strategy is almost in place: BA embarked on a major fleet re–equipment programme to bring the fleet in line with the new liberalised air service environment.
That meant downsizing many routes to the 777 from its ageing 747 fleet. It then moved on to disposing its older Boeing short haul fleet, replacing it with the flexible A320 family. This re–equipment is almost over. There are currently only 16 aircraft on order between now and 2008.
Over the past few years it has also gradually been rolling out the "dusk" product on long haul business class — the innovative sleeper service — and incorporating the fourth class of the premium coach class service.
In the belt tightening announced early in 2002, the company set itself cost saving targets of an annual run rate of £650m by end FY March 2004. In all areas it appears to have been on or above target. In fact the annual running cost saving by the end of March will have reached £850m.
Distribution channel shift
The largest percentage difference from targets is in the area of distribution.
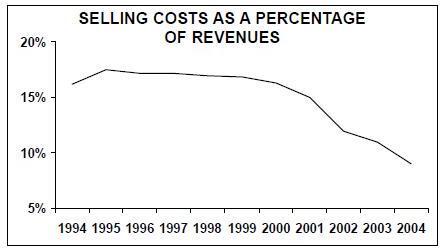
BA says it has achieved a cost saving of some £212m per annum against a target of £100m. There are several elements to this disparity. At the end of 2003, the company reduced agent’s commissions in the UK (to a 1% booking fee) and in the US to zero; the success of ba.com has resulted in a significant distribution channel shift, which in itself has led to selling efficiencies. At its worst, selling costs as a percentage of revenues approached 18% in 1995.
This proportion will have been halved by the end of March 2004.
Currently travel agents account for some 65% of all bookings, online through ba.com and call centres around 12% each with the remaining 10% coming from other online agents. The company is anticipating that by March 2007, ba.com will account for nearly 30% of bookings, there will be a shrinkage in the proportion of bookings from call centres and a minimal change in the proportion of bookings from other online engines.
Even then, traditional agents would account for at least 50% of bookings. The bookings from ba.com and call centres overall account for 28% of bookings, which means that some 72% of bookings go through the four major GDSs.
The company has recently renegotiated deals with the four major GDSs to reduce transaction costs by a further £80–90m.
This channel shift is bound to accelerate. Domestically, the company is enforcing this through a renegotiated 1% on travel agent’s commissions, an emphasis on e–tickets, with a charge for physical tickets, the introduction of the facility to pay by debit card on ba.com and increasingly, a service fee for wanting to speak to someone. The increasingly apparent effect of the internet phenomenon is to reduce the cost, time and effort involved in resolving easy questions.
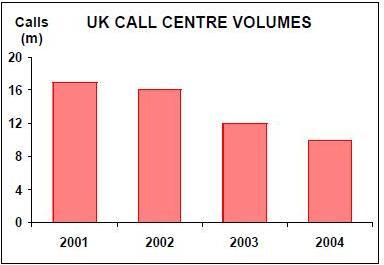
The company’s call centres have been cut back dramatically in the past three years with a reduction in staffing levels from 2,400 in 2001 to 1,400 in 2003/4. Calls to the BA call centres have fallen from 17m calls a year in 2001 to 10m currently.
A major part of the success that BA can claim in the past two years is the development and roll out of ba.com — the internet based booking system. The company has put in place an unparalleled system for any of the major carriers. It is easy and simple to use: it allows the user to find the lowest fare for the trip he wants with minimal fuss.
BA has been enhancing the system with this very fact in mind. It now allows the passenger to confirm seat allocation, and to check in.
It will shortly allow the passenger to print out his own boarding pass. Throughout the design the company has emphasised simplicity: and has been rewriting the convoluted booking restrictions to make it even easier for the punter to understand what he is buying.
Finance
After September 11, 2001 there were severe concerns that BA would not have the funds to survive without coming to the capital markets for funds. (This worry helped push the share price below the 1987 flotation price). At the time the company averred that it had sufficient liquidity and flexibility to do so. So far, it has proved this to be the case.
At the end of September 2001, the company had some £1.2bn cash and cash facilities available against a debt burden, including leases, of £7.8bn. At the time, its debt repayment schedule showed repayments averaging £500m a year up to 2007, with a peak in 2005 of £790m.
Through its belt–tightening procedures it has built its cash resources over the past three years to some £2bn. At the same time its has been rescheduling its debt profile and repaying some elements early. It has reduced its total debt position to just above £5bn by the end of December 2003, (although this figure was flattered to the tune of £400m by the strength of sterling over the period) and the repayment schedule has been flattened to an average of £550m a year over the next five years, with no peak repayments. Also, the company has increasingly been fixing its interest costs so that now some 60% of its net debt is at fixed rates, compared with only 30% in FY2001, with a forecast average rate of 4.5% for FY2005.
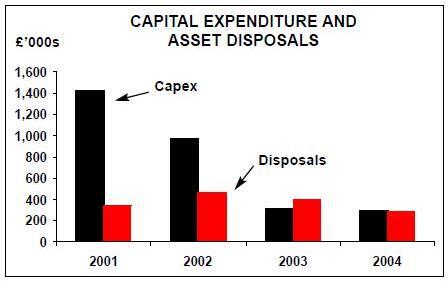
BA also reined back on its capital expenditure programme — although it was, in any case, coming to the end of its fleet re–equipment programme, (see chart, below).
Revenues and costs
In the immediate aftermath of the September 11 atrocities, we anticipated that there would be a relatively swift recovery in industry traffic levels.
BA also assumed this in its forecasts then and plans to return to a 10% margin. In fact, there has been a far more damaging impact of the terrorist attacks on demand — not least of all the significant increase in security measures, constraints on travel imposed by authorities and the weak economic environment.
The Gulf War, the Bali bombing and SARS added even further to the general malaise.
BA’s FSAS plan effectively provided for modest downsizing in activity.
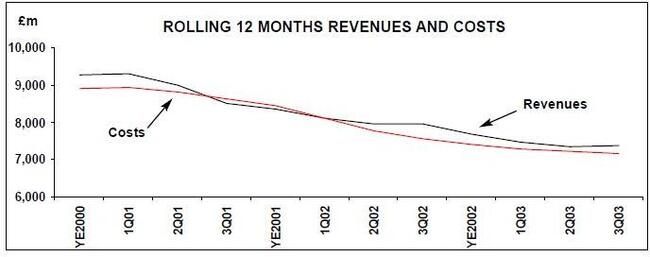
This, combined with the weak industry environment, lead to a near £2bn drop in annual revenues since the end of FY2001 — annual revenues for the year ended March 2001 reached £9.3bn. For the 12 months ended December 2004 they had fallen to £7.4bn.
For FY2002 and FY2003 the main driving force behind this drop was a fall in traffic — BA managed to maintain its pricing and mix fairly satisfactorily.
In the year to March 2004, however, despite a pickup in traffic volumes, there has been a continued downturn in mix of class and a worse downturn in price. For the nine months to December, traffic grew by 1.9% while yields fell by 6.7% and unit revenues fell by 5.3%. The December quarter was in fact a little more encouraging with a 3.3% increase in traffic, only a 0.8% decline in yields and a reasonable 1.8% increase in unit revenues.
On long haul services, premium traffic actually rose against prior year levels in August 2003, for the first time since 2001, whereas economy class travel has been showing modest growth.
On short haul, premium cabin traffic continues to run below prior year levels. Economy class travel meanwhile has been rising above prior year levels for the past year and haul CHECK has now started to exceed the levels of 2000/01.
This shift in traffic mix is increasingly visible as a structural shift in the European industry. The propensity of UK business passengers to travel in premium cabins has been declining over the years.
For long haul traffic, it remains at around 40–50% of travellers. For short haul, there appears to have been a fall from 60% to 40% over the decade from 1991 to 2001 — and then the ratio has fallen off the cliff to a rate of 20% currently.
This accelerated decline in the past three years can partly be explained by the emergence and expansion of the LCCs and the competitive response from the flag carriers (BA included).
However, the company is finally seeing an end to the decline in revenues. It is suggesting a modest 2–3% increase in turnover for the year ended March 2005.
On the cost side, costs have fallen by £1.7bn in the same period to a running 12- month rate at the end of December 2003 of £7.2bn. In the short run, BA emphasised some cost headwinds that could add some 5% to the cost level for the coming financial year: the pension problems will require an additional £133m funding p.a.; fuel costs have jumped again and are likely to push costs up by a further £50m despite the company’s hedging policies; in addition there will be pay increases, volume related costs and increases in landing charges.
Meanwhile the company continues to implement cost saving strategies. It is half way through its "external spend" plan to reduce costs by £300m.
It is on track to deliver cost savings of £150m from its "ceBA" (customer enabled BA) and other initiatives. It has further set itself the target of reducing employee costs by a further £300m by December 2006 — and in this it has unusually put the question to the unions to see if they can resolve an answer.
The original target of achieving a 10% operating margin remains — if the date of managing the achievement has been put back further than expected.
Overall, BA has performed as it said it would. In fact it has performed better.
The only problem is that the industry basics have fallen away and the original plan to regain reasonable sustainable profitability has been delayed further. The saving grace is that BA is still alive and kicking and is in a far better shape to allow it to achieve its 10% operating margin through the cycle and provide CVA returns for its shareholders.
| . | ||||||||||
| Achieved by | Target end | |||||||||
| Dec ‘03 | Mar ‘04 | |||||||||
| MPEs | ||||||||||
| Manpower | ||||||||||
| reductions | 12,652 | 13,000 | ||||||||
| £m | ||||||||||
| Manpower cost | ||||||||||
| 460 | 450 | |||||||||
| savings | ||||||||||
| Distribution cost | ||||||||||
| 212 | 100 | |||||||||
| savings | ||||||||||
| Procurement / | ||||||||||
| IT savings | 123 | 100 | ||||||||
| Total | 795 | 650 | ||||||||
| Disposals | 723 | 900 | ||||||||