Outlook: this is not an industry tragedy
April 2003


War in Iraq has caused passenger numbers to plummet again, forced serious capacity cut–backs, pushed United closer to Chapter 7 and American to Chapter 11, and undermined further the fragile finances of many of the European flag–carriers. There has been the usual clamour for state aid on both sides of the Atlantic.
But to put things in perspective this is not a tragedy for the aviation industry.
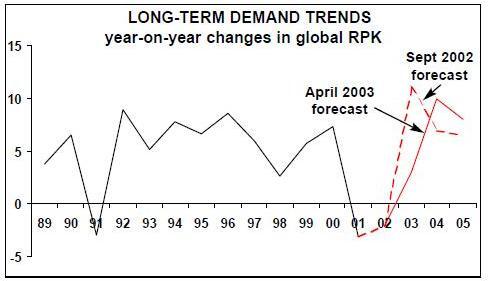
Clearly our regular forecast needs updating. Last October we were looking at a global traffic recovery of nearly 12% (RPK traffic growth) for 2003, explicitly not factoring in the impact of an Iraqi war. Now we are hazarding a 3% growth rate taking into account the current slump in traffic but assuming a relatively quick resolution of the conflict and a resumption of traffic growth in the second half of the year. We are also hoping that the SARS outbreak doesn’t have a lasting effect on Asia/Pacific business. The upturn is now scheduled for 2004 — a predicted 11% growth rate. Why persist with this recovery scenario?
Firstly, we are irredeemable optimists. Secondly, it is still logical to assume a resumption of long–standing relationships between the level of economic activity and commercial air transport.
Aviation Economics' forecast assumes that traffic by the end of 2005 will return to close to the levels — up to 100% for non–US carriers and 90% for US carriers — that it would probably have been at had September 11 not happened. Even with a substantial rebound next year and good growth the following year, the average annual growth rate for the period 2000–05 will be just 2.7%.
To take another illustration: Robert Gordon, a renowned airline economist, has considered potential US revenue growth by reviewing historic GDP/airline revenue ratios. During 1989–2000 the average ratio of airline revenue to nominal GGP was 1.29%, ranging from a low 1.24% in 1992 to a peak of 1.33% in 2000. If the ratio is set at 1.14% for the period 2002–2009, reflecting a significant change in consumer behaviour, and the nominal GDP growth averages 5% (i.e. 3% real growth plus 2% inflation), then the theoretical growth in airline industry revenues works out at a startling 7% a year over this period.
The point is that it is very easy to lose sight of the strong long–term growth characteristics of air travel by focusing, quite naturally, on the disasters of the past two years. The strength of the recovery when it comes may well be a pleasant surprise.
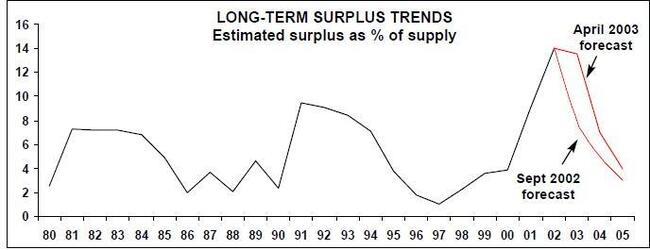
Turning to the supply/demand outlook (for methodology see Aviation Strategy, October 2002), the record surplus of roughly 14% of supply continues throughout 2003 in contrast to our previous prediction that it would fall to 9%.
Nevertheless, here too, things are not as terrible as they seem. That 14% surplus equates to about 2,200 jet units. Of these, according to Aviation Economics' calculations, at least half will never return to commercial service because they are either Chapter 2 types or Chapter 3 types over 25 years of age. On the supply side we are allowing for new jet aircraft output from Airbus, Boeing, Bombardier and Embraer of 800–plus units a year over the next years.
Even so, a combination of supply adjustment, through the de facto scrapping of uncommercial types, and the anticipated demand rebound means that a return to a "normal" surplus of 4% is achieved by the end of 2005 (see graph below).
So far we have described the industry outlook in physical supply/demand terms. The financial picture is changing more dramatically.
The fall in average yields is probably permanent. It is based on unit cost reduction resulting from distribution innovation, higher labour and aircraft productivity instigated by the LCCs, and will be reinforced by remodelling of hub network systems and the continuing expulsion of state–directed airlines from the marketplace.
Aircraft prices, both new and second–hand, have not simply fallen in the familiar cyclical pattern, but have been substantially reduced to a new base level.
This is the brave new aviation world.
| US | US | US | Euro | Euro | Euro | Asian | Asian | Asian | World | World | World | |
| Dom | Int'l | Total | Intra | Int'l | Total | Dom | Int'l | Total | Dom | Int'l | Total | |
| 2000 | 6% | 7% | 6% | 2% | 7% | 7% | 9% | 11% | 11% | 5% | 9% | 7% |
| 2001 | -7% | -6% | -7% | 1% | -1% | -1% | 1% | 0% | 0% | -4% | -2% | -3% |
| 2002 | -2% | -3% | -2% | 1% | -3% | -2% | 2% | 0% | 1% | -1% | -2% | -2% |
| 2003 | 2% | 1% | 2% | 5% | 3% | 3% | 6% | 5% | 5% | 3% | 3% | 3% |
| 2004 | 7% | 12% | 8% | 6% | 14% | 13% | 7% | 13% | 11% | 7% | 13% | 11% |
| 2005 | 5% | 7% | 6% | 5% | 10% | 9% | 7% | 10% | 9% | 6% | 9% | 8% |