Super-connectors: Two good,
two bad?
September 2018

Our view of the Super-connector sector is: there are two very successful models — Emirates, with its mega-bub at Dubai operated with A380s and 777s, and THY’s long-haul, mostly 737, operation based at Istanbul — with both airlines achieving consistent profitability, displaying financial transparency and, despite the closeness of their relationships with their respective governments, not receiving direct subsidies. Then there are two models — Etihad and Qatar Airways — which have been successful in copying Emirates operationally, but which have never achieved commercial viability, have been supported financially by their governments and have been very opaque about their accounts.
Consequently, there is a supply/demand imbalance in the Super-connector sector. The graph below summarises the outlook, relating historic seat capacity offered by the Super-connector group compared to a probable demand projection. Following the series of political and economic crises in the Middle and Near East, the Super-Connectors as a group are no longer growing traffic at anything any their pre-2014 rates of around 15% pa. They have reverted to a “normal growth” profile, roughly 4-5% pa, yet the fleet plans and official scheduled deliveries still imply a 10%-plus capacity growth rate for the Super-connector group.
Tentatively, there could now be a 24m seat gap between theoretical supply and demand, which will have to be resolved through aircraft deferrals, cancellations and adjustments to delivery schedules — or through airline rationalisation. (24m seats equates to 19m passengers, which is roughly the traffic Etihad carries at present.)
In late September it seemed that a long-speculated Super-connector merger was a possibility. Bloomberg, which normally has reliable sources, reported that preliminary talks were taking place with the aim of Emirates acquiring at least the main airline business of Etihad. Unfortunately, both airlines denied the report, although the two managements have been discussing issues like joint-security and the transfer of surplus Etihad pilots to Emirates.
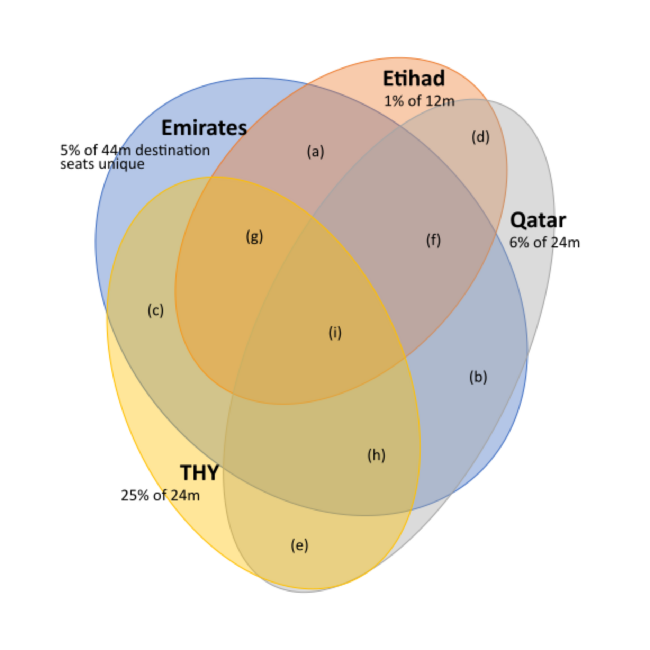
Nevertheless, if there is to be any consolidation in the Super-connector sector Emirates-Etihad is by far the best bet. The graph below details the overlap between the seat capacity offered by the four carriers. For instance: only 5% of Emirates total seat capacity is on routes to destinations to which the other three do not operate.
THY realistically is not in the running for any consolidation moves: the political and cultural differences are too large. Qatar — currently ostracised by its neighbours — is not in any position realistically to talk about joint ventures let alone mergers. However, the two UAE airlines overlap immensely, albeit that Emirates is over three times the size of Etihad: 73% of Emirates’ seat capacity operated to the same destinations as Etihad’s, and 93% of Etihad’s capacity deployed to the same airports as served by Emirates.
Contrasting fortunes
Latest financial results underline the growing schism between the commercial and the statist Super-connectors.
James Hogan , CEO of Etihad from 2006 until his departure last year, was responsible for the multi-airline investment strategy, with its vague promise of mutual feed to boost the airline’s catch-up growth strategy — in reality a series of hopeless airline investments- and is now apparently running a private equity fund in Switzerland. His legacy at Etihad, and it had been obvious for years, was strategic chaos. Hogan’s successor, appointed in September 2017, is Tony Douglas, formerly of BAA, Abu Dhabi Ports and most recently the UK Ministry of Defence, who has begun a reorganisation and restructuring programme at the airline. It is too early to assess the impact of his reforms, but it is somewhat disconcerting that the headline in The Times when he quit the MoD was ‘Defence chief Tony Douglas jumps ship and “leaves MoD in chaos”’.
Etihad has produced some operational and financial results for calendar 2017 with comparisons to a restated 2016. Both sets of numbers refer to “core” operations without defining what this means, but presumably it is an attempt to insulate the Abu Dhabi airline operation from transactions involving Air Berlin, Alitalia, Jet Airways, Darwin (Etihad Regional), etc. Passenger volume and load factor remained more or less static at 18.6m and 78.5% in 2017 but total revenue edged up to $6.1bn. Core airline loss was $1.52bn, a margin of -25%, though an improvement on 2016’s $1.95m, -33%, loss. We have been unable to reconcile the 2016 core result with any previously published Etihad result.
Still, Etihad is a relatively open compared to Qatar Airways. Even passenger numbers have not been reported since June 2017 when Qatar was abruptly embargoed by its Arab neighbours including Saudi Arabia, UAE and Bahrain as punishment for the country’s alleged support for the Muslim Brotherhood. We estimate that for the full year, taking into account the embargo effect, passenger volumes for 2017/18 would have been roughly the same as the previous year — 32m. Overall, Qatar has not had to retrench too much in capacity terms: it was forced to close 18 routes but over the past year has added a similar number of new destinations, many in Eastern Europe.
CEO Akbar Al Baker has warned of a “substantial loss” to be reported for 2017/18 as the result of what he describes as the “illegal embargo” of his country. The accounts were due to be published in September but have not been revealed yet, though the airline has made indications in press statements. It claims that revenue increased by 7%, largely due to a 34% growth in its cargo business and its loss might be $69m (which does not seem particularly bad given the extent of the embargo.)
The problem is Qatar’s financials have to be treated with a degree of caution. For instance, the 2016/17 published results showed a profit “attributable to shareholders" of $528m on revenues of $10.3bn, but this included various exceptional items — including some $575m in profits on asset sales, mostly aircraft sale and leasebacks; in underlying terms the Group appears to have produced an operating loss of $490m. In any case, such details are not too important in a hydrocarbon economy which has the highest GDP per capita, US$125,000, in the world.
Meanwhile, Qatar has expanded its investment portfolio this year, acquiring 50% of AQA, the parent company of Meridiana, which was re-launched as Air Italy. Qatar is leasing five A330s to Air Italy, as part of a plan to grow the carrier to 50 units (737 Maxes and 787s). Already however, the US majors are complaining about unfair subsidies for Air Italy which has started transatlantic services from Milan to New York and Miami. Qatar has also bought 25% of the third Moscow airport, Vnukovo, and a minority stake in JetSuite, the US private business jet operator.
These investments appear a little out of character with Qatar’s previous concentration on prime oneworld assets — Qatar Airways has built up a 20% stake in IAG while the Qatar Sovereign Wealth Fund owns 20% of Heathrow Airport. It also has 10% stakes in oneworld members Cathay Pacific and LATAM and had a proposed 10% investment in American rejected.
THY’s unique long-haul narrowbody hub operation has proved resilient in the face of political turmoil within Turkey, the devaluation of the Lira and, lately, an acrimonious fallout between Presidents Recip Erdoğan and Donald Trump.
After plunging into losses in 2016, after the attempted coup when tourism to the country collapsed, the airline recovered strongly in 2017, turning a $350m operating loss into a profit of $794m, driven mostly by holding capacity growth at 2%, increasing average load factors by 4.7 percentage points system wide, and pushing up yields by 2.9% — so RASK was up 6.0% overall, while CASK was held at 2016 levels.
Results for the first half of 2018 show a resumption of capacity growth, partly due to THY bringing parked aircraft back into service, of 9.2%. But this was surpassed by a traffic resurgence of 15.2%, with the consequence that RASK still grew by 15% (with only a minor currency boost) as load factors again grew by over 4 points and yields increased by nearly 11%. CASK was up by 11%, mostly due to fuel, and overall THY turned $69m operating loss into a $270m profit.
Average load factor for 2018 is expected to be over 81%, and total traffic is projected to be 75m passengers, close to capacity at Atatürk Airport. Fortunately, Europe’s new mega-hub is scheduled to start operating in November — İstanbul New Airport or İGA located at Arnavutköy, north of the city’s European side, 45km away from Atatürk. Initial capacity with three runways will be 90m passengers a year, (compared to current throughput of 78m at London Heathrow and 65m at Frankfurt). Further development will take İGA to 120m passengers by 2022.
Having suffered a shock in 2016/17 when its profits slumped, Emirates reined in capacity expansion in 2017/18; total ATKs, passenger and cargo, grew by just 2%, partly the result of retiring 8 widebodies to accommodate the delivery of 17 new A380s and 777s. Although by far the largest A380 operator and the sole orderer of this type in recent years, Emirates fleet policy is evolving to a more conventional mix of widebodies and ultra-widebodies (Aviation Strategy, November 2017).
With passenger volume up 4% to 58.5m, average load factor moved back up to 77.5% from 75.1% in the previous year. Total revenue for the airline (excluding dnata) increased by 8.5% in 2017/18 to US$25.2bn, aided by an improvement in yield and a positive currency effect, while profit attributable to shareholders jumped by 124% to $762m.
However, this equated to a profit margin of just 3%, which is significantly below the 10% margins Emirates regularly used to achieve and which is still the shareholders’’ target. Again this underlines the logic behind a capacity rationalisation by the two UAE airlines. Plus the fact that Emirates’ fuel bill has now risen to 28% of total costs may also enhance the attraction of Etihad, based in hydrocarbon-rich Abu Dhabi, to Emirates, which with declining oil reserves in Dubai is exposed to global fuel prices.
Merger thoughts
Slightly unusually for an airline merger the most important issue in a Emirates-Etihad amalgam would be regal. The closely related ruling families of Dubai and Abu Dhabi — Al Maktoum and Al Nahyan — are intimately associated with their airlines, and aviation is more of a prestige industry than, say, aluminium, where two rival companies were successfully merged to form Emirates Global Aluminium in 2013. One of the strengths (or potential weaknesses) of the Dubai aviation sector is that one person, Sheik Ahmed Al Maktoum, ultimately controls Emirates Airline, flydubai, dnata, the CAA, Dubai Airports etc. Could Etihad and Abu Dhabi Airports be smoothly added to this portfolio?
In theory, Emirates plus Etihad would create the world’s largest airline by RPKs, but the real issue is rationalisation. For the merger to make commercial sense, capacity has to be taken out of the super-connector systems; specifically Etihad’s extensive orderbook will have to be re-negotiated (the new management there have apparently already started talks). Etihad is scheduled to receive an average of 24 units a year in the medium term, a mixture of 777s, 787s, A321s and A350s (see table). Emirates is due to receive 21 units a year, one third A380s, the rest 777s over the medium term (before delivery of its latest A380 order kicks in).
There is also the airport question — rationalisation of the hubs would also be required. DXB handled 88m passengers in 2017, close to its limit, estimated at 90m, and Emirates is due to start transferring operations to the all-new Al Maktoum International (Dubai World Central). The Dubai Government forecasts both airports to have capacity for 150m passengers by 2025 by which time Emirates should have transferred all its operations. The ultimate aim is for DWC to handle 240m passengers a year, but the precise date for that throughput is not being specified. Meanwhile, Abu Dhabi is also close to capacity with 25m passenger throughput and the government invested in facilities which will soon bring that up to 45m.
Consolidating at the DWC mega-hub would be rational, but regional sensibilities will probably not permit that. The solution then is a dual hub system à la Air France and KLM at Paris and Amsterdam. And the commercial risk is that Emirates-Etihad would end up like Air France-KLM in terms of management and branding, which is the easier merger option but not one that delivers full benefits of rationalisation, albeit through the brutal suppression of the weaker brand, United/Continental or America/USAirways for instance.
Percentage of destination seats in direct competition
| Capacity intersection | Emirates | Etihad | Qatar | THY | |
| a) | EK∩EY | 73% | 94% | ||
| b) | EK∩QR | 83% | 78% | ||
| c) | EK∩TK | 76% | 62% | ||
| d) | EK∩QR | 93% | 66% | ||
| e) | QR∩TK | 81% | 65% | ||
| f) | EK∩EY∩QR | 68% | 89% | 64% | |
| g) | EK∩EY∩TK | 60% | 77% | 44% | |
| h) | EK∩QR∩TK | 66% | 66% | 53% | |
| I) | EY∩QR∩TK | 74% | 57% | 42% | |
| j) | EK∩EY∩QR∩TK | 56% | 72% | 56% | 56% |
| k) | EY∩TK | 79% | 45% |
| Period | Pax (m) | Change | Pax LF | Change | Rev. ($bn) | Change | Op Result ($m) | Change | Net Result ($m) | Change | |
|---|---|---|---|---|---|---|---|---|---|---|---|
| Emirates Group | FY 2017/18 | 58.5 | 4.3% | 77.5% | 2.4pts | 27.9 | 8.1% | 1420 | 44.4% | 1106 | 67.2% |
| THY | 2017 | 68.6 | 9.3% | 79.1% | 4.7pts | 10.9 | 9.5% | 794 | from -350m | 223 | from -77m |
| 2018 (1st half) | 30.3 | 17.8% | 80.4% | 4.3pts | 5.9 | 29.2% | 270 | from -69m | 41 | from -434m | |
| Etihad ("Core") | 2017 | 18.6 | -0.5% | 78.5% | (0.1pts) | 6.10 | 3.3% | na | na | -1520 | 22.1% |
SUPERCONNECTOR MEDIUM TERM SCHEDULED DELIVERIES
| 2018/19 | 2020 | 2021 | 2022 | 2023 | 2024 | ||
|---|---|---|---|---|---|---|---|
| Emirates | 777 | 12 | 12 | 17 | 12 | 14 | 18 |
| A380 | 15 | 10 | 9 | 6 | 1 | ||
| Total | 27 | 22 | 26 | 18 | 15 | 18 | |
| Etihad | 777 | 2 | 3 | 5 | 4 | 3 | |
| 787 | 15 | 8 | 17 | 6 | 6 | ||
| A321 | 2 | 5 | 6 | 4 | 9 | ||
| A350 | 4 | 10 | 4 | 13 | 7 | 9 | |
| Total | 21 | 20 | 29 | 30 | 21 | 21 | |
| Qatar | 777 | 8 | 7 | 7 | 11 | 11 | 10 |
| 787 | 8 | 11 | 11 | ||||
| A320/21 | 6 | 11 | 12 | 11 | 10 | ||
| A350 | 16 | 12 | 6 | 5 | |||
| A380 | 1 | ||||||
| Total | 39 | 41 | 36 | 27 | 21 | 10 | |
| THY | 737Max | 24 | 24 | 15 | 12 | ||
| A321neo | 25 | 25 | 25 | 14 | 3 | ||
| Total | 49 | 49 | 40 | 26 | 3 | ||
| Super-Connector Group | 777 | 20 | 21 | 27 | 28 | 29 | 31 |
| 787 | 23 | 19 | 28 | 6 | 6 | ||
| A350 | 20 | 22 | 10 | 18 | 7 | 9 | |
| A380 | 16 | 10 | 9 | 6 | 1 | ||
| A320 family | 33 | 36 | 42 | 31 | 17 | 9 | |
| 737 | 24 | 24 | 15 | 12 | |||
| TOTAL | 136 | 132 | 131 | 101 | 60 | 49 |
Notes: 2018/19 contains some units already delivered; Firm orders only