AirAsia Group: Consolidation should
lead to transparency
June 2017

After almost going into the red in 2014 during what AirAsia called a “perfect storm” of aviation incidents, geopolitical unrest and natural disasters, the region’s leading LCC recovered strongly in 2015 and 2016. But first quarter 2017 results revealed operating profits down by a quarter and a net profit decline of a third. Is the AirAsia Group heading for another troubled year in 2017?
AirAsia is the undoubted pioneer of the LCC business model in the Asian region, and today the group and its associate carriers have a major presence in six countries (excluding the long-haul affiliates AirAsia X, Thai AirAsia X and Indonesia AirAsia X, which are not covered in this article).
It is the largest carrier in terms of seats operated in Malaysia and Thailand — the second and third largest markets in the ASEAN region (see table) — supplanting the local legacy flag carriers with a capacity share respectively of 25% and 20%, and is the third largest operator in the Philippines with a 10% share of the market.
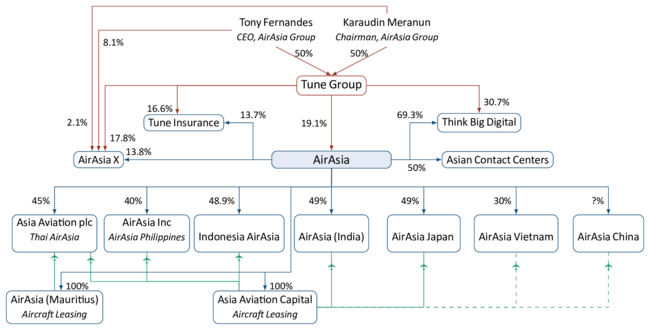
The nub of its problems as it expands in the region is that, while ASEAN has gradually moved towards a region-wide open skies regime, the countries have not reached any agreement on a common regulation for airline ownership and control. Consequently AirAsia’s moves into countries outside its home base of Malaysia has by necessity required majority local shareholding investors and has led to a necessarily complicated group ownership structure and an opaqueness in financial reporting (see chart).
Intriguingly AirAsia has renegotiated some of its shareholder agreements to specify that it does have actual management control over its associates. As a result it has been able to consolidate the results of the Philippines and Indonesian operations and hopes to be be able to do the same for the Thai operations.
This should go some way towards improving transparency in the accounts. There have been some suggestions that the group may float AirAsia Investment Ltd (AAIL) — the vehicle through which it holds the investments in the associate airlines — and possibly in a good jurisdiction such as Hong Kong. In the short term it may be more practicable to expect local IPOs (see below).
Following the nightmare year of 2014, in which net profit dropped 77% year-on-year to RM82.8m (US$25.3m) — see Aviation Strategy, June 2015 — the AirAsia group made a significant recovery in 2015, posting a net profit of RM541m (US$139m), and followed this up with a substantial net profit of RM2,047m ($495m) in 2016.
However, in the first quarter of 2017, despite a 7.7% rise in group revenue to RM2.2bn (US$0.5bn) operating profit fell 24.3%%, to RM391m ($88m), and net profit decreased by 33.4%, to RM584m ($131m). While passengers carried rose by 6% in the quarter year-on-year (to 9.2m) and load factor increased by 4% (to 89%), unit revenue growth of 3% was swamped by a hefty 14% rise in cost per ASK.
The problem for AirAsia is that there wasn’t just one cause of the fall in unit margins, with the airline citing higher fuel prices, staff costs and user charges. The average fuel price for the group was US$67 per barrel in January to March 2017, compared with US$56 per barrel in Q1 2016, while staff costs increased 27% year-on-year due to higher pilots’ pay. And user charges rose 17% year-on-year thanks to lower incentive payments from airports.
That is of concern given that an intense focus on costs is clearly at the heart of the group’s overall strategy, which have three key pillars and which are all based around themes of “digitalisation” and cost discipline. They are:
- Passenger revenue: AirAsia claims to be the world’s lowest-cost airline (in terms of CASK), and through new associate joint ventures intends to gradually expand its footprint through the Asia region, with a planned 8-10% growth of capacity annually.
- Ancillary revenue: AirAsia aims to strengthen what it calls its “ancillary income machine”, through initiatives such as enabling wi-fi of its entire fleet by the end of 2017; developing “Big duty free” (i.e. inflight delivery of purchases made online); “connection fees” for baggage transfers etc
- Releasing special dividends for shareholders, via the continuing sales of non-core business. It has announced plans for an IPO of its AACE flight crew training centres. Final bids were due in at the end of May for the sale of its leasing business, Asia Aviation Capital — which we understand has some 50 A320s on its books, all but two leased to the AirAsia group carriers — expected to raise a little over $1bn.
Group airlines
The AirAsia group fleet and the associate airlines in Thailand, India and Japan (but excluding the three long-haul affiliates) totals 180 aircraft, all of which are A320s (see table). Within the group structure there are 81 of the model at the Malaysian operation, 17 in Indonesia and 16 in the Philippines. The affiliates add another 54 aircraft in Thailand, 10 in India and two in Japan.
On outstanding order are three A320-200s, 297 A320 neos and 100 A321neos. The A321neos were ordered in July 2016, for delivery from 2019 onwards, and are will be used by AirAsia to provide extra capacity at slot-constrained Asian airports. Of the huge outstanding order book for A320s, 29 aircraft will be delivered through to the end of 2017.
The key strategy for the airlines, as AirAsia Group CEO Tony Fernandes puts it, is: “regional consolidation and streamlining group operations across the board”. The group accounts now consolidate the Malaysia, Indonesia and Philippine units (with Thai AirAsia expected to join in the second quarter of 2017), and Fernandes adds that “we are taking a major step to being recognised as one airline, not many — AirAsia as OneAirAsia, sharing a single cost structure and bringing immense benefits in terms of economies of scale”.
Malaysia
Based at Kuala Lumpur, the Malaysian airline is still the most important part of the group — operating to more than 70 destinations from five hubs — though its percentage of total passengers carried on the group’s short- and medium-haul airlines has been falling steadily as other operations have built up (see chart) — from 63% in 2009 to less than 47% in 2016.
But revenue pressure is growing in Malaysia. Average fares at Malaysia AirAsia had fallen for five years in a row, from RM177 (US$54.9) in 2010 to RM157 in 2015, before improving to RM167m in 2016. However, the average fare fell yet again in the first few months of 2017 year-on-year, from RM175 in Q1 2016 to RM171 (US$38.5) in Q1 2017 — and this wasn’t compensated for by a RM1 increase in ancillary income per passenger over the 12-month period, to RM50 (US$11.2) in Q1 2017.
Worryingly, the same trend is seen in the (positive) gap between unit revenue and cost at the Malaysian airline. It fell from 4.48 sen (1.46US¢) in 2011 to 0.67 sen (0.2US¢) in 2014, before rising to 3.09 in 2016 — but in the first quarter of 2017 the gap shrank to 1.3 sen, which was less than half the 2.45 sen gap achieved in Q1 2017.
Indonesia
In Indonesia, the AirAsia airline operates to 16 domestic and international destinations out of three main hubs (Jakarta, Surabaya and Medan), though the group gave no detail of financial performance in the first quarter of 2017.
Philippines
Operating out of Manila to 16 destinations, AirAsia Philippines reported operating profit of ₱400m (US$8m) in Q1 2017 — its best quarter yet. Passengers carried increased by 19% year-on-year and revenue rose by 41%. The airline aims to double its fleet over the next three years, and this will be funded by a planned IPO sometime in the second half of 2017, which will aim to raise around US$200m.
Associates
The group’s share of profits at associates declined 58% in the first quarter of 2017 year-on-year, to RM34m (US$7m), and it’s these associate carriers that are consistently proving to be the biggest challenge for the group — partly because ownership of these carriers is shared with local investors, partly because of their need for cash.
Thailand
The group owns 45% of Thai AirAsia (itself 51% owned by Bangkok listed Asia Aviation), which is based in Bangkok and serves just under 50 destinations domestically and through the Asia region. It reported a 2% increase in revenue for Q1 2017 — to ฿9.2bn (US$262m) — although operating profit fell 44% to ฿1.2bn ($34m) and net profit was 43% down at ฿1bn ($28m). The fall in profits was attributed to weakness in the China-Thailand travel market, which saw average fares plunge 9% year-on-year, with ancillary revenue also falling by 4%. It did not help that Thailand increased passenger departure taxes. Altogether, unit revenue fell by 5% in Q1 2017 (compared with Q1 2016), while unit costs rose by 8%.
India
The Indian associate saw revenue up 47% year-on-year in Q1 2017, to ₹2.8 hundred crore (US$42m), but AirAsia India posted an increased operating loss of ₹53.9 crore ($8m) — 15% up year-on-year — and a net loss of ₹40.5 crore (compared with a ₹46.9 crore loss in Q1 2016). Again, average fares fell, this time by 7% year on-year, with ancillary revenue per passenger falling even faster, at 17%.
Based at Bengaluru airport, in the south of the country, all AirAsia India’s flights are domestic (linking 15 airports), though its intention is to start international services sometime in 2018 now that the restrictive 5/20 regulations have been eased. The AirAsia group has a 49% stake in AirAsia India, with 40% held by Tata Sons and 10% by Arun Bhatia’s Telestra Tradeplace.
Japan
The latest associate is AirAsia Japan, in which the group has a 49% stake and rest being held by an eclectic mix of local investors, comprising private equity company Octave Japan (19%), online retailer Rakuten (18%), aircraft lessor Noevir Holdings (9%) and sportswear firm Alpen (5%). The airline was established in 2016 after a previous venture into the Japanese market in partnership with All Nippon Airways in 2012/13 failed. The Japanese carrier plans to operate from Nagoya from June, initially with a fleet of two A320s, and prior to launch racked up a net loss of RM39.7m (US$9m) in the first quarter of 2017.
China ambitions
In May AirAsia filed an application with the relevant authorities to launch an LCC in China, to be based at Zhengzhou (a city in the east of the country and almost equidistant between Beijing and Shanghai). China is clearly is the biggest aviation market in Asia, but LCC penetration is very low, accounting for between 6-8% of total domestic passengers.
However, AirAsia faces many hurdles before it can launch operations (which ideally it would like to do by the spring of 2018). The Big Three (Air China, China Eastern and China Southern) will fight hard against the entry of Asia’s most successful LCC into their home market, using their government and lobbying contacts to deny the licence or at worst (from their point of view) to limit the scope of slots and routes that AirAsia might use.
AirAsia will not be intimidated by such opposition, and cites reforms made in the country in 2014 that encourage low cost operations in the country, such as abolishing minimum fare rules and cutting airport fees in many secondary cities. The Chinese government is certainly keen to develop routes into secondary airports as it is investing substantial amounts of capex into its aviation infrastructure outside of the main cities.
The AirAsia group airlines currently operate around 15 routes into mainland China, and its Chinese offshoot would operate in partnership with the provincial Henan government and China Everbright Group, a state-owned financial services conglomerate.
An AirAsia associate airline in Vietnam is also due to launch in early 2018, with AirAsia owning 30% and local investor Gumin (based in Hanoi) having a 70% stake. The carrier will operate routes domestically and internationally out of three bases — Ho Chi Minh, Hanoi and Da Nang. However, AirAsia is late to this market as the country already has two LCCs — VietJet Air (which operates a fleet of 40 A320s and A321s) and Jetstar Pacific Airlines (with a fleet of 14 A320s).
Another potential AirAsia operation is reportedly planned for Cambodia, according to local sources. AirAsia currently operates daily services between Kuala Lumpur and Phnom Penh and Siem Reap, and is adding a route from the Malaysian capital to Sihanoukville from August.
A wobbly 2017
The AirAsia group is not exactly weak financially — as at the end of March 2017, deposit, cash and bank balances totalled RM2,552m (US$574m), 47% higher than 12 months previously and partly thanks to a share issue that raised RM1bn ($226m). Total debt for the group stood at RM10.3bn (US$2.3bn) — some RM331m ($74m) less than a year previously.
Nevertheless, following the fall in profitability in the first quarter, analysts will look closely at April-June results when they are released sometime in August.
A key indicator as to how AirAsia will fare through the rest of 2017 will be given by how successful the group has been in driving further cost savings among its airlines. A further annual cost reduction of $45m (called the “Power of One” programme) is being targeted through tightening of operating expenses at all group airlines (ranging from annual cost savings of $2m in Japan to $14m in Malaysia), plus an annual group procurement saving of $14m — so the group is clearly indicating that it can recover quickly from the bumpy first quarter by yet another tranche of cost cutting.
| Total | 173 | 3 | 8 | 297 | 100 |
| A320ceo | A320neo | A321neo | |||
|---|---|---|---|---|---|
| In service | On order | In service | On order | On order | |
| AirAsia | 73 | 3 | 4 | 297 | 100 |
| AirAsia (India) | 10 | ||||
| AirAsia Japan | 2 | ||||
| Indonesia AirAsia | 17 | ||||
| Indonesia AirAsia Extra | 5 | ||||
| Philippines AirAsia | 16 | ||||
| Thai AirAsia | 50 | 4 | |||
AIRASIA MARKET POSITION IN ASEAN AND INDIA
| Market size | AirAsia | ||||||
|---|---|---|---|---|---|---|---|
| Country | (m seats) | Rank | Seats | Share | #1 | #2 | #3 |
| India | 215.9 | 7 | 6.2 | 2.9% | Indigo (27%) | Jet Airways (15%) | Air India (12%) |
| Indonesia | 175.6 | 4 | 9.3 | 5.3% | Lion Air (43%) | Garuda (29%) | Sriwijaya (6%) |
| Thailand | 140.5 | 2 | 24.9 | 17.7% | Thai Airways (18%) | Lion Air (8%) | |
| Malaysia | 95.8 | 1 | 34.7 | 36.2% | Malaysia Airlines (23%) | Lion Air (12%) | |
| Singapore | 79.6 | 3 | 4.9 | 6.1% | SIA (50%) | Jetstar (7%) | |
| Vietnam | 70.6 | 4 | 1.8 | 2.6% | Vietnam Airlines (39%) | VietJet (23%) | Jetstar (11%) |
| Philippines | 64.5 | 3 | 5.9 | 9.1% | Cebu (33%) | PAL (29%) | |
| Myanmar | 12.2 | 3 | 0.9 | 7.5% | Air KBZ (10%) | Myanmar National Airlines (8%) | |
| Cambodia | 10.6 | 2 | 1.3 | 12.2% | Cambodia Angkor Air (12%) | Vietnam Airlines (11%) | |
| Laos | 3.7 | 3 | 0.4 | 10.5% | Lao Airlines (41%) | Vietnam Airlines (12%) | |
| Brunei | 2.2 | 2 | 0.3 | 11.7% | Royal Brunei (77%) | SIA (5%) | |
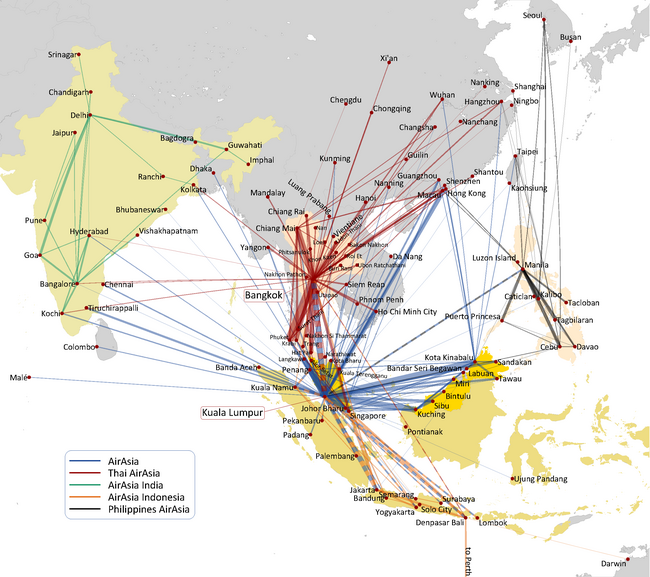
Note: thickness of lines directly relqated to number of seats operated
Source: AirAsia presentation