2018: Placidity
and/or turmoil
December 2017

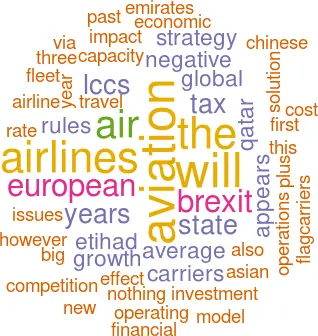
Optimistic headlines from IATA in its 2018 global outlook — stabilising but historically high net profits globally, demand exceeding capacity, ROIC exceeding WACC — suggest a placid year ahead (though IATA does point out that upturns in the air travel cycle typically last eight years, and we are now in year eight). As usual our observations tend to focus on the turmoil.
2017 saw the end of the Etihad effect on European aviation, with the dismantling of its investments as Alitalia, Air Berlin and Darwin declared bankruptcy — a development that had been long anticipated and which should enable a rationalisation of the sector. Unfortunately, the shadow of Brexit also looms over the continent.
This time last year we said that probably nothing would happen in 2017 with regard to Brexit and aviation. The UK Transport Secretary, Chris Grayling, did his utmost to fulfil this expectation — managing to evade all the difficult questions about a policy he campaigned for, and blandly repeating that there is nothing to worry about as flights from the UK will continue as normal after March 2019 because the Spanish need the income from British tourism. Nothing so far on some vital issues like ownership rules, intra-European operations by UK airlines, UK position in EC bilaterals, EASA regulation, etc.
Until recently we took a bit of comfort from the fact that the government was conducting economic impact assessments on 50-plus industrial sectors, including aviation and aerospace, “in excruciating detail” according to the Brexit Ministry, but it turned out that it wasn’t. (For non-UK readers: in December the Brexit Secretary, David Davis, was forced to hand over the assessments to a parliamentary committee, and they turned out to be little more than cut-and-pastes from Wikipedia.)
Some of the latest thinking on aviation Brexit issues plus Aviation Strategy’s own attempt to quantify the potential impact on intra-European services was published in the October edition, but we struggled to find constructive answers to the questions posed by the policy. As there is no chance of negotiating a bespoke aviation agreement, or any trade agreement, before March 2019, the official exit date, there are two logical outcomes. First, a hard Brexit where the UK leaves the single aviation market and the liberal regulatory framework it was instrumental in creating — in short, a disaster. Second, a Norway-type solution with the UK becoming in effect an EEA member and British aviation becoming part of the European Common Aviation Area (ECAA). This will be presented as a temporary transitional measure but will probably be long extended — the UK will find itself subject to EU rules but have no influence on setting the rules — which is anathema to the Brexiteers.
The US
The US has become the main generator of the airline industry’s global profitability — the result of domestic consolidation, not just through mergers but also through a consolidation of ownership by investment funds, most notably Warren Buffett’s Berkshire Hathaway, which have taken stakes across the four Major airlines.
There are downsides, however. Passengers are not too keen on 84% average load factors, for example, as the leading airlines exert “capacity discipline”, which means zero or negative growth. And unions, after the traumatic experience of Chapter 11, are beginning to flex their muscles again. In the first three quarters of 2017, the Majors’ average EBIT margin slipped to 18.6% from 22.7% in the same period of 2016, largely the result of higher fuel prices, which the US carriers are particularly susceptible to. Compared to European or Asian airlines, their fleets are quite elderly — Delta’s fleet is on average 18 years old, United’s 15, even Southwest has a 12-year-old fleet.
Capex programmes are overdue, and President Trump’s corporate tax reforms, cutting federal corporation tax rates from 35% to 21% would appear to provide a catalyst. However, the immediate effect on the US airline industry is not that clear.
Looking at the P&L accounts filed within the annual Form 10Ks, it appears that the airlines are taxed at 35%-plus for Federal, State and Other taxes combined. This is officially designated the “effective rate”. But the “cash rate” — our term for moneys actually paid over to the tax authorities — for the four Major airlines averaged 2.6% mostly because the Big Three have accumulated in the past a huge amount of NOLSs (Net Operating Losses) against which they provision, rather than actually pay, taxes (United appears to have received a refund in 2016, and Southwest used accelerated depreciation rules to cut its tax bill). In total the Big Three have about $21bn in NOLs at the end of 2016 which can be used to minimise or eliminate tax payments. So, surprisingly, the Trumpian reform isn’t as dramatic as presented, at least for the airline industry.
Middle East
The Middle East airlines — specifically the super-connectors, Emirates, Etihad and Qatar — have been hit by a storm of negative events — the ban on electronic items on flights to the US and Europe, the US Fair Skies campaign, the collapse of Etihad’s’ investment strategy and the Arab embargo against Qatar.
Political events have exposed fundamental over-capacity and over expansion issues. The Fair Skies campaign, however hypocritical the US Big Three’s lobbying appears, has thrown light on the financials of Etihad and Qatar. Qatar has more than enough hydrocarbon wealth to continue its global hub operation despite the embargo, and to accelerate its investment strategy — a much better quality version of Etihad’s, focusing on oneworld, taking stakes in IAG, Lan Chile and Cathay Pacific, and attempting to buy into American.
Having increased seat capacity at an average of about 15% pa for the past ten years, 2017’s growth rate will turn out to be around zero. Even if some form of normality is quickly restored, future growth of likely to be in the 4-6% pa range, which causes a problem as the fleet plans to the early 2020s are based on growth rates of over 10% pa.
The manufacturers will have to take part of the pain through deferrals and maybe cancellations (as Aviation Strategy pointed out in November, Emirates’ reluctance to firm up an additional order puts the whole A380 project at risk of termination).
With the management associated with the equity alliance strategy now gone, is there a possibility of an Emirates/Etihad merger? Ultimately it will be a political decision, or a royal one, but it is interesting to have an objective picture of the financials of the two carriers. Emirates is totally commercial with positive cashflow and profits distributed to its state shareholder, Dubai, via dividends. Etihad has been losing money at the operating level, has negative cashflow, and has had to rely on injections of state funds from Abu Dhabi to cover capex.
Asia/Pacific
Asia/Pacific is a complex network of different markets, but a common theme is the how competition between the flag-carriers and the new wave of LCCs is playing out
The flag-carriers — Air India, MAS, Garuda, Thai, PAL, Vietnam Airlines — are diverse, with hugely different economic power, yet they are all tied to their national governments. Despite some high-profile conflicts with their state owners, there appears to be little chance of any of them disappearing in the short/medium term, as happened with the smaller European flag-carriers. Indeed, SIA remains the model for these carriers, associating efficiency and service with state ownership/control (via Temasek in SIA’s case)
Their financial performance has generally been uncommercial — negative numbers at the EBIT level for at least the past five years (though some upticks recently), and they are unable to compete on cost with the new wave of LCCs; their short/medium haul networks are in direct competition.
The European solution of cross-border mergers with networks focused on feeding global hubs (Air France/KLM model) does not exist, and their long-haul operations are not readily defensible against the superconnectors or the expansionist Chinese carriers; they are in reality niche operators in the long-haul sector.
The economic solution might be take-overs by the new LCCs, but this is still politically unpalatable. Transferring operations to a lower cost associate — the Qantas/Jetstar model — is a possibility.
Asian LCCs too are diverse — Indigo, SpiceJet, Air Asia, Cebu Pacific, Lion Air, Vietjet, etc — with intense competition among them via transnational affiliates. They have adopted many of the operating efficiencies of the best European and US LCCs to the Asian market, yet there are some differences — multi-type fleets, for instance. Also, there is a high degree of financial opacity — Lion Air and Cebu do not reveal financial detail. To what extent have their mega-orders been placed with a fixation on achieving the lowest possible unit cost?
Finally, observing Japanese travel trends over the coming years will be intriguing. It is the first developed country to have a population in marked decline. What will be the impact on JAL, ANA and their subsidiaries? Will air travel to/from the country come to be dominated by Chinese tourists carried on Chinese airlines?
| American | Delta | United | Southwest | Total 4 | |
|---|---|---|---|---|---|
| Revenues | 40.18 | 39.64 | 36.55 | 20.42 | 136.79 |
| PBT | 4.3 | 6.64 | 3.82 | 3.54 | 18.3 |
| PBT Margin | 10.7% | 16.8% | 10.5% | 17.3% | 13.4% |
| Provision Income Taxes | 1.62 | 2.26 | 1.55 | 1.3 | 6.73 |
| "Effective" Tax Rate | 38% | 34% | 41% | 37% | 37% |
| Income Tax Paid (Refunded)† | 0.01 | 0.03 | (0.42) | 0.85 | 0.47 |
| "Cash" Tax Rate | 0.2% | 0.5% | -11.0% | 24.0% | 2.6% |
Source: Form 10k
† estimated by subtracting actual tax cashflow from provisioned tax
| US $bn | Emirates | Etihad |
|---|---|---|
| Turnover | 110.5 | 25.6 |
| EBIT | 6.5 | -1.1 |
| Margin | 5.9% | -4.4% |
| Operating Cashflow | 17.2 | -2.5 |
| Net Capex | 9.4 | 5.3 |
| Free Cashflow | 7.8 | -7.7 |
| Net Debt increase | 5.5 | 8.5 |
| Shareholder investment | 0.0 | 9.3 |
| Dividend payments | -6.4 | 0.0 |
Notes: Emirates five financial years ending March 2017. Etihad five financial years ending Dec 2015.
Source: Company reports
Source: IATA
Source: IATA
Source: IATA
Source: UN DESA